
Energy system stability: risks, opportunities & the decarbonised future
Introduction
Being able to turn on a light is dependent on the stability of each link in what is a long, complex energy supply chain. An issue affecting any of these links can have an outsized impact on the energy system. And as we have witnessed in 2022, the impact that the manifestation of these risks has resulted in high energy prices, and in turn, global inflation. In this paper, we discuss:
- Energy system risks: three independent risks which have driven the spike in energy prices globally
- Investing in the context of risk: identifying where risks are in a supply chain can uncover potential opportunities
- Future risks: as our energy systems evolve, there are new risks to consider, including system reliability, unbacked intermittent renewables, supplier risk and the potential loss of Australia’s energy advantage.
1. System risks: origins
If efforts are not made to ensure the integrity of every link of a supply chain, it will be vulnerable to a complex range of risks. In the period post the onset of COVID in 2020, we have seen three examples of the manifestation of these risks in energy markets, all of which have contributed to the significant return of inflation (see Chart 1):
- ESG-constrained capital flows into traditional energy fuels (oil, gas, and coal), inhibiting the expenditure necessary to ensure reliable fuel supply
- High levels of growth in intermittent renewable energy, in conjunction with coal-plant retirements, without adequate backup to manage extended periods of underperformance
- Over-reliance on politically questionable suppliers of energy, in the case of Europe’s reliance on Russian gas, oil and coal
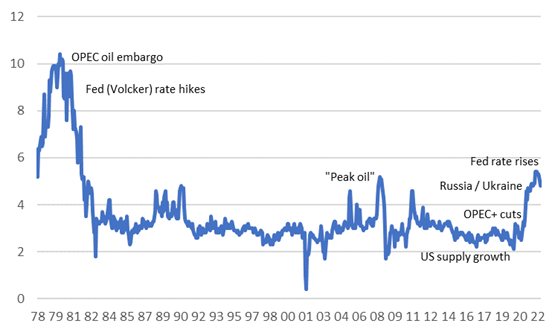
Chart 1: oil prices vs inflation expectations
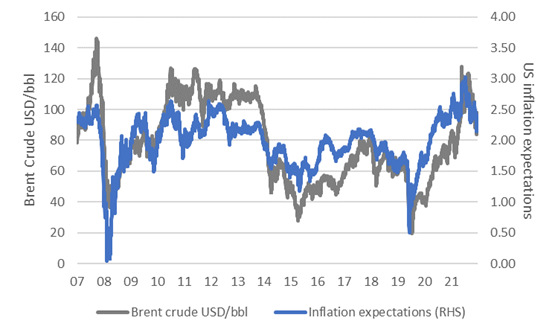
Sources: Bloomberg. Federal Reserve of St. Louis. Calculations: Merlon Capital.
Risk 1: constrained capital flows
Despite our longer-term objectives of decarbonisation, roughly two-thirds of electricity is still generated through the burning of oil, gas and coal. As such, generating electricity is heavily reliant on the secure supply of these fuels. Yet with capital for carbon-intensive fuel investment increasingly difficult to obtain due to the pivot towards renewables investment, capital expenditure across these fuels has declined by more than 40% on average over the past decade. This compares to an average demand growth across these fuels of more than 10%.
Chart 2: underinvestment in carbon-intensive fuels
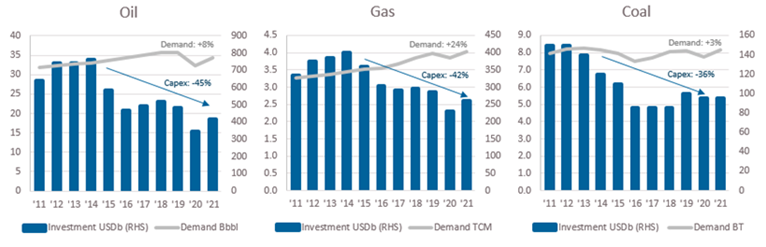
Source: International Energy Agency. Calculations: Merlon Capital.
This persistent underinvestment has seen an increasingly vulnerable supply chain across all traditional fuels, which, given renewables variability (see below), the COVID-stimulus-driven demand recovery, and Russia’s military activities, have all combined to increase demands on this weakened supply chain, which can only be resolved through higher prices as per the charts below, or ultimately demand destruction.
Chart 3: pricing of carbon intensive fuels
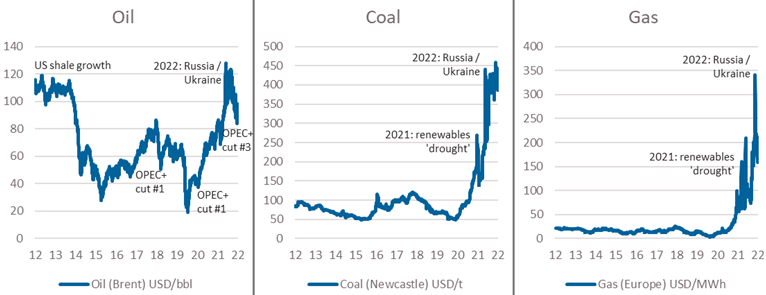
Source: Bloomberg. Calculations: Merlon Capital.
Considering each of these commodities in more detail uncovers some interesting nuances. In the cased of oil, given Russia’s importance to the global oil supply (~10%), it appears surprising that although oil has rallied, it has significantly underperformed gas and coal since the beginning of the year. This has been a function of the 3-5% of additional supply which was still to come from OPEC as it entered 2022. While the cartel has not met this supply normalisation, it has still represented an overhang on market pricing, despite the recent announced cuts. It has also been muted by Russia’s ability – to date – to redirect oil to other destinations such as China, India, and Turkey. In addition, supply was boosted by US President Biden’s direction to sell roughly 1mbpd from the US Strategic Petroleum Reserves. These have all combined to result in adequately supplied oil markets.
In the case of gas, on the other hand, supply has been tight since 2021, when northern hemisphere renewable energy experienced prolonged underperformance, and demand for gas rose to backstop electricity grids. Exacerbating this market dynamic was Russia’s invasion of Ukraine in early 2022. Russia is a large supplier of gas into Europe at roughly 50% of gas imported. In response to Western sanctions on Russian oil, Russia has responded by significantly constraining the supply of Russian gas flows into Europe. As a result, gas prices have risen to unprecedented levels.
And coal? Coal and gas are close substitutes in electricity generation, with coal prices influenced heavily by the availability and price of gas. The gas flow disruptions from Russia into Europe noted previously are resulting in previously idled coal-plants restarted, and the demand for coal rising. Yet sanctions have also been applied to Russian coal, meaning the greater demand for coal has been met by lower supply. The key nuance to consider is that Russian coal, and European demand for it, are related to specifically to high calorific value (CV) coal (6,000 kcal). High CV coal is only a small part of the global coal market. There is no significant shortage of the more abundant low energy coals from Indonesia. Thus, the high coal prices we are seeing relate primarily to high CV Australian coal as the only other supplier of this product in scale, thereby benefiting Australian producers of this product, and impacting other consumers, most notably Japan, South Korea and Taiwan.
Risk 2: unbacked intermittent renewables growth
Globally, renewable energy represents one-quarter of total electricity generated, having grown 79% over the past decade. In the reverse effect of what we noted in the section above, these high levels of investment resulting in high levels of supply saw a market balanced through declining electricity prices.
Chart 4: electricity generation by source (global)
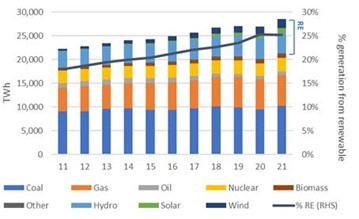
Source: BP Statistical Yearbook. Calculations: Merlon Capital.
Yet underneath this politically and environmentally favourable trend was a latent and growing risk: if a system becomes more reliant on a more variable source of supply, and the ability to backstop the system through similarly growing ‘firming’ capacity (whether carbon intensive or otherwise) is not evident, the system as a whole will have been weakened. In fact, not only was new firming capacity not sufficiently developed, existing baseload capacity was in fact removed. And in the early 2021 period, we saw this risk manifest, as wind and solar ‘droughts’ in the northern hemisphere resulted in a system short of energy, and a market forced to pay up for coal and gas fuels to firm up the supply of electricity (https://www.merloncapital.com.au/whos-got-the-energy/), in the absence of batteries, pumped hydro, hydrogen, and other zero-carbon firming capacity.
In the case of Australia – energy self-sufficient, and far from the weather patterns of the northern hemisphere – we have witnessed the relatively easy phase of the transition phase. We have a system that had excess baseload capacity, which despite closures of some coal fired capacity, has been sufficient to backstop the intermittency of our renewables growth. From here on, however, as coal fired generation capacity retirements accelerate (see Chart 8, below), and with renewables penetration already at around 25%, the absence of firming capacity to backstop the continued growth exposes Australia to similar risks to those seen in the northern hemisphere in 2021.
Risk 3: reliability of key suppliers
Risks to supply can also manifest in the level of exposure to a single supplier and their reliability. Given its wealth of natural resources, in particular energy, and its proximity to Europe it is no surprise that Russia is the dominant supplier to the region. This supplier concentration is most evident in the case of Germany, relying on Russia for more than half of its coal and gas supplies. This relationship began in a small scale in the 1950s, before gathering pace from the 1970s onwards, cemented further through the development of large-scale oil and gas pipelines to service the region.
Chart 5: European gas supply by source
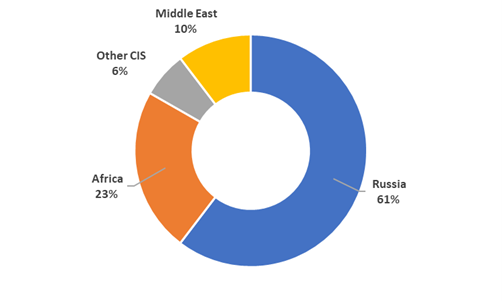
Source: BP Statistical Yearbook. Calculations: Merlon Capital.
From Germany’s perspective, the availability of large volumes of cheap and reliable supplies was essential to the development of a globally competitive industrial powerhouse. In short, German industrial economics won over the geopolitical considerations associated with such a large supplier. For a number of decades, this risk lay dormant. In 2014, however, with Russia’s annexation of Crimea, these risks began to reveal themselves. Despite this, Germany’s energy procurement policy remained unchanged.
And yet this lack of responsiveness to Germany’s implicit funding of Russia’s military adventures is not new. Russia’s invasion of Afghanistan in 1979 was followed in 1980 by an agreement to construct a dedicated 4,500km pipeline from Western Siberia to Germany, doubling Germany’s imports of Russian gas. In this way, Germany has both funded Russian military, and exposed itself to the whims of an increasingly belligerent Russia. Germany is now left with the unenviable task of rapidly building out alternative gas supply arrangements to replace a supply chain which took decades to develop, and which was relatively cheap due to pipeline infrastructure.
This supply chain replacement will be costly at many levels:
- The need to negotiate supply deals in a global market already paying a premium for the security of supply;
- The cost of securing alternative supplies of high-energy coal to replace the lost Russian gas flows;
- The need to invest in LNG import infrastructure;
- The redirection of capital away from renewables development; and
- The need to invest amidst a rapidly rising cost of borrowing.
2. Investing in the context of risk
We have been following Risk 1 (constrained capital flows) for some time (see https://www.merloncapital.com.au/oil-pricing-in-a-more-realistic-recovery/). In identifying this risk, coupled with declining energy prices, we grew increasingly confident that there was the likelihood of a tightening pricing environment (see chart 2).
At the risk of repeating ourselves, we expected energy markets to tighten because any demand or supply shock to an underinvested (read, ‘undermaintained’) system would be magnified. And the nature and timing of the shock itself does not necessarily need to be forecast explicitly due to the inherent randomness of economies, geopolitics and increasingly, the environment. With supply unresponsive, in the short-term at least, the only shock absorber to restore balance is price. In essence underinvestment creates the opportunity for higher future returns.
At Merlon, we constantly look for these situations, where conditions of growing risk can be accompanied by potential opportunities, some of which may more than compensate for these risks – that is, an increasingly favourable risk / return trade off.
We often find that the positive trade-off is most pronounced where the media and industry participants have become overly negative. Although conditions may be negative, and a litany of reasons why ‘the end is nigh’, it rarely turns out as bad. In fact, if conditions improve to only being less bad, the degree of negativity embedded in equity prices can result in appealing returns.
In the case of commodities, what we specifically look for are the combination of defined conditions. While seemingly counterintuitive, these conditions include:
- Underinvestment, and (preferably) / or:
- A loss-making industry
The combination of these two conditions is particularly powerful, as underinvestment, often triggered by low prices and a loss-making industry, in turn leads to reduced risk of further price falls and eventually price recovery as supply tightens from both underinvestment and the exit of loss-making participants. While not a certainty, the odds at this point of a cycle are most heavily in an investor’s favour relative to any other point of the cycle. We want to invest when the risk / return skew is most heavily in our favour, noting that 100% certainty is not a possibility in markets.
Possible scenarios for energy prices:
Where in 2019/20 excess LNG supply growth saw gas prices collapse, pushing coal prices down also, albeit less that gas, driving an historically high coal-to-gas ratio. Today we see the inverse of this situation, with gas supply constrained by Russia, driving the gas and coal prices higher, albeit with coal prices less so, driving the historically low coal to gas price ratio.
Chart 6: coal pricing dynamics
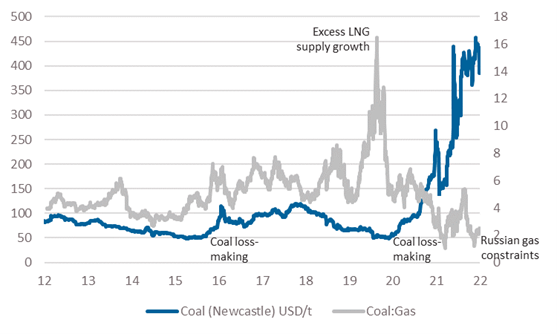
Source: Bloomberg. Calculations: Merlon Capital.
From here, we are monitoring the trade-off between downside risks from demand destruction (likely), gas supply returns (possible), and increased coal supply (unlikely), relative to the upside risk from a continuation of underinvestment (likely) whereby carbon-intensive commodities become increasingly scarce in the process of decarbonisation.
Inflation?
It is interesting to note that as fears of recession have grown, and oil prices have declined, inflation expectations have shown signs of a turning point. Little wonder then, Biden’s negative response to the most recent OPEC+ 2mbpd production target cut. We would note, however that this ‘cut’ is unlikely to alter the current market balance given underperformance of OPEC members relative to their targets, coupled with the likelihood that demand is possibly worse than those outside the market realise – OPEC sees daily customer demand nominations which are not visible to the broader investment community.
Chart 7: University of Michigan Inflation Expectations survey
Source: Surveys of Consumers, University of Michigan, University of Michigan: Inflation Expectation©[1]
3. Future risks
Australia’s global position in the decarbonised future stands in stark contrast to Australia’s privileged position in an industrialised, carbon-intensive global economy. While the changing relevance globally is clear, the changing nature (read, ‘growing’) of our risks should be considered.
In many ways, the path forward for Australia (and globally) appears clear: invest heavily in renewable energy generation, alongside the development of firming capacity (batteries, pumped hydro, hydrogen, and gas), in order to meet our net zero 2050 targets (albeit with the largest emitters in China, and third largest in India pushing, their own net zero target dates to 2060 and 2070 respectively).
Yet again, underneath this accepted path lie significant risks, all of which we noted above, and reiterate below in the context of our future path towards a decarbonised economy:
Risk 1: constrained capital flows
In some ways, this risk looks unlikely to change as we decarbonise. In the face of our coal fleet retirement, and the increasing likelihood of this path accelerating (Chart 8, below), the incentive to invest capital to maintain coal mines and coal fired power stations is diminishing further. The risk here, then is seemingly clear: system reliability underpinning 75% of our electricity is declining. The number of coal-fired generations outages seen over the past 12 months is indicative of this trend.
Chart 8: AEMO forecast coal capacity (step-change scenario) vs announced capacity (GW)
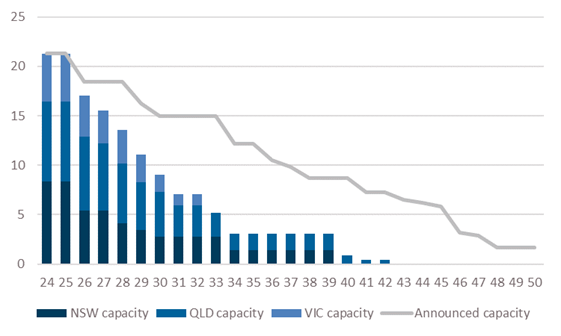
Source: AEMO.
As governments become more nervous (state and federal) in the face of an accelerating retirement path, and rapid, but not rapid enough build out of renewable generation to backfill the departing coal-fired generation, we are potentially moving into the phase of knee-jerk reactions in order to regain a sense of control. As we have seen in the Federal government’s increasingly over-budget, over-time Snowy Hydro 2.0, NSW’s 2021-announced ‘Electricity Infrastructure Roadmap’ and the recently announced Victorian government’s decision to re-establish the State Electrical Commission, government at all levels is growing in size in Australia’s future electricity generation. While this gives a sense of greater certainty, the budgetary over-runs in Snowy Hydro 2.0, coupled with the reduction in private investment that has occurred since intervention gathered pace under the previous federal government, ultimately crowds out investment, introduces the tax payer to cost over-runs, and risks reduced accountability as the political cycle continues.
Risk 2: unbacked intermittent renewables growth: Outside of these risks, which have been acknowledged at the highest level of government, we have an additional supply risk, in the form of managing what is an intermittent source of energy. Our acceleration in the removal of coal-fired generation – again, as we have seen in the case of Europe – means these risks are increasing. To date, the growth of intermittent renewable capacity has been largely backstopped by an oversupply of baseload and peaking generation. Looking ahead, however, as the retirement of coal fired capacity continues (Chart 8), renewable generation growth will form an increasingly large percentage of our energy mix, necessitating a solution to intermittency outside of baseload plants, or else face a 2021-like situation seen in the northern hemisphere.
Risk 3.0: reliability of key suppliers: In a manner similar to that of Germany today and its supply of gas energy today, Australia’s future renewable energy supply chain has already become highly reliant on a politically questionable supplier. China is currently the manufacturer of 80% of the world’s panel supply (IEA, July 2022). This is level is similar in the case of lithium-ion batteries and other renewable generation and storage components and processed raw materials such as lithium.
Our exposure to this supplier will only grow as our coal retirement path rolls on (Chart 8, below), our generation fleet becomes more renewable, and our car fleet becomes increasingly electric, and our housing stock replaces its gas supply with electricity, demanding significantly greater imports of photo-voltaic panels, electrolysers, wind turbines, lithium and other ‘critical minerals’ from China. Furthermore, we will be competing with the rest of the world to secure this supply, delivering even greater geopolitical leverage to China.
And, in turn, like Russia’s invasion of Ukraine, Australia’s (and the world’s) growing reliance on China for renewable energy generation and storage inputs may facilitate an escalation of tensions between China and Taiwan. In such a situation, and should Australia object in any way, it is not hard to see risks to this supply. We have already seen how China is readily willing to ‘punish’ Australia should it wish, as we have seen in 2021 with their banning of Australian coal. Energy has always been a geopolitical issue, and likely to increasingly be the case. And as such, we may witness more supply shocks contributing to energy disruption as well as inflation going forward.
Risk 3.1: reliability of key suppliers
In the industrialised, carbon-intensive economic era post the 1850s, Australia has been ‘energy-advantaged’ with large volumes of cheap domestic gas supplies. In a similar way to Germany’s key supplier of cheap energy being Russia, we have been our own key supplier, and hence the reliability of this supply is still a critical question.
The chart below shows that before the commencement of large-scale LNG exports from Australia’s east coast in 2015, Australia enjoyed significant energy competitiveness. From this point onwards, however, we can see how Australian spot gas prices have converged on international prices. It is important to note that despite this spot price convergence, contract prices (which affect the large-scale domestic electricity and industrial user base) have yet to fully converge. This is due to the lagged effects of long-term contracts rolling, as well as being a market that has been, until very recently, well-supplied with gas.
Chart 9: Australian domestic spot gas price vs international netback equivalent AUD/GJ
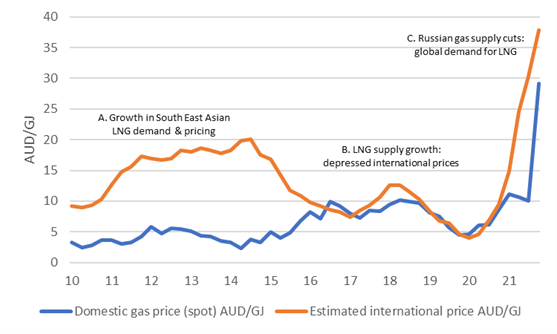
Source: St Louis Federal Reserve. Australian Energy Regulator. Calculations: Merlon Capital.
As noted originally, the cost to Germany of what was a reliable source of cheap gas, becoming an unreliable supplier, has been the need to construct a second gas supply infrastructure, including large scale LNG import terminals. According to the ACCC, Australia could also be facing a shortage of domestic gas from 2023, albeit not to the same scale as Germany currency faces. Yet given the lack of investment in new capacity to service the lower priced (historically) domestic market, coupled with growing ESG-driven restrictions, Australia is now faced, like Germany, with the need to invest in a gas import infrastructure, beginning with import terminals in Geelong and potentially Port Kembla also. With this new infrastructure comes the new direct link via imports to international market pricing (in addition to links via export hubs).
Where to for Australian electricity prices
Given the key role of gas in electricity price formation (see chart below), we are now able to model what could happen to our electricity price forecasts when we are increasingly exposed to a regional (rather than domestic) gas pricing regime. Using a relatively neutral international LNG price forecast of USD9.50/mmbtu (based on Brent oil futures of USD74/bbl), converting this into a domestic ‘netback’ gas price of AUD13/GJ, and then using the historical relationship between gas and electricity prices, we forecast a possible wholesale electricity price of AUD130/MWh.
In short this implies a ‘normal’ future electricity pricing environment 60% higher than the average over the period since 2010. It is important to note that this forecast is not based on today’s elevated spot international gas prices, but a return to a pre-COVID, pre-Russia / Ukraine ‘normal’ oil-linked contract environment (if such an environment is possible). Not only is this inflationary, but it also may signal the end of Australia’s era of energy advantage.
Chart 10: domestic gas prices vs electricity prices
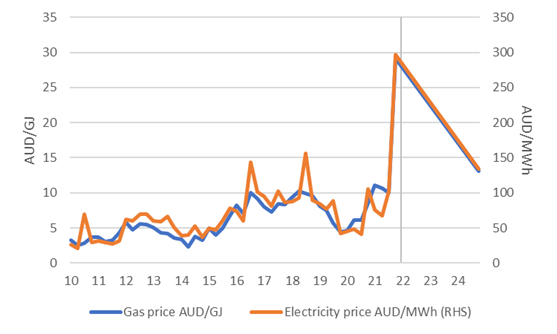
Source: Australian Energy Regulator. Calculations & forecasts: Merlon Capital.
Who to blame?
Although the export of large volumes of what is effectively ‘unconventional’ (read, costlier) gas via the Curtis Island LNG hub implies that we are exporting gas from a nation that is set to be short gas, this gas is only flowing due to investments that were only worth making due to their ability to sell it at higher international prices (see point A. in Chart 9 above). Selling into the domestic market at the prevailing pricing regime would have rendered the investment loss- making, hence a disincentive from making this investment. Chart 11 (below) shows the true, all-in cost that needs to be covered ‘through the cycle’ for the project to have been worth making. The widely publicised ACCC operating cost line is not wrong, yet it ignores other costs including the cost of the project’s original construction, the cost of financing this project, and the additional ‘return’ required to compensate for the risk of the investment.
Chart 11: gas price vs true project economics
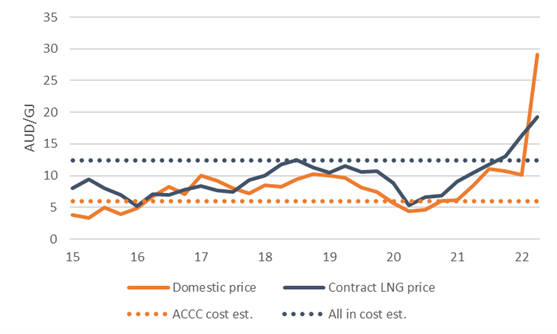
Source: Company Reporting (sample QLD LNG producer). ACCC. Calculations: Merlon Capital.
In other words, this gas would not have reached the ground had it not been for a higher priced export opportunity, rendering these projects economic. Its existence now does not imply it necessarily should be made ‘available’ to any party, given the need for it to generate a return on the investment required to bring it to the ground. As such, forcing the re-routing of contracted export volumes into the domestic market at economically loss-making prices poses a sovereign risk for future large-scale investment in Australia.
And this debate, necessarily suffers as a result of its politicisation. And the cost of this debate includes reduced focus on avoiding the future energy supply crunch, a reduced incentive for domestic and international parties to invest large scale sums of capital into new energy projects, and poor decisions made by governments reluctant to rely on markets and feel it necessary to more directly control investment (as noted above), in a style more reminiscent to centrally planned economies, and all the associated inefficiency that this involves.
So, does linking domestic gas prices to international markets mean future investment in large scale gas capacity is now incentivised? While potentially making new investment attractive, our original point on constrained capital flows is considered likely to prevent such capital flowing into new domestic east coal gas investment at a scale likely to resolve the anticipated shortage.
However, one positive in terms of actual availability of gas is Viva Energy’s Geelong terminal project, which, if it proceeds, is expected to source gas from Woodside’s west coast supplies, including its recently sanctioned Scarborough project. While possibly priced at internationally referenced markets, it will at least mean we may be able to backstop our decarbonising electricity system, a positive in an increasingly complex and costly energy transition.
Conclusions & portfolio considerations
Having previously identified and invested in the opportunities made available through prolonged underinvestment in traditional energy fuels and invested on the basis of the estimated risk / return trade-offs, we have been steadily reducing exposures as companies in this space have outperformed. These positions have included Ampol, Viva Energy, Woodside, Santos, New Hope, and Whitehaven.
We continue to look for new opportunities through this lens, regardless of their sector, and demonstrate patience in waiting for such opportunities to become truly compelling. Conversely, we look for situations where capital flows are relatively unconstrained and seek to avoid these given the likelihood of excess supply and low future returns.
Australia’s increasingly constrained energy future, as we have shown, contains many risks. Yet we do expect to see opportunities for a sensible government, industry and financial level debate in order to manage these risks as early as possible. And from an investment perspective, as we have shown, with risk can come opportunity.
[1] Surveys of Consumers, University of Michigan, University of Michigan: Inflation Expectation© [MICH], retrieved from FRED, Federal Reserve Bank of St. Louis https://fred.stlouisfed.org/series/MICH/, (Accessed on 12/10/22)
Author: Ben Goodwin, Analyst/Portfolio Manager