
Long-term Dividend Opportunity the Main Game
Long-term dividend prospects relative to share prices haven’t looked this good for many years. With short-term dividends under pressure as a result of the COVID-19 induced economic downturn, we thought it would be a good opportunity to take stock of the near-term outlook but also present the case for taking a long-term view, focused on sustainable free cash flow. After all, dividends are merely a subset of this cash-flow. The key points are:
- Free cash flow is a better measure of value than dividends. As strange as it seems, directors often set dividends (and engage in buybacks) with little regard to the sustainable free cash flow backing the dividends, or appropriate debt levels. A company’s fundamental value is best determined by focusing on sustainable free cash-flow combined with overly pessimistic market expectations.
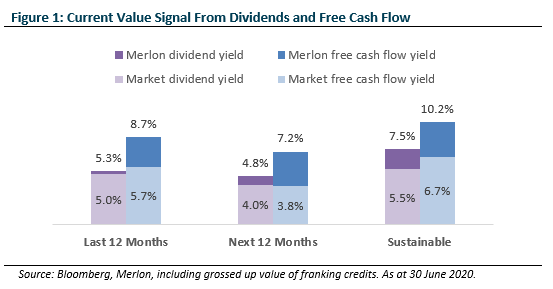
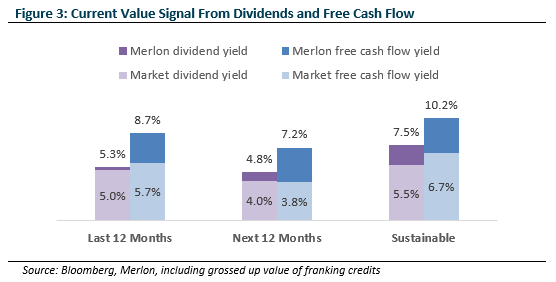
- The long-term sustainable free cash flow and dividend outlook is very attractive, as evidenced in Figure 1 below.
- The outlook for near-term dividends is weaker and difficult to predict, particularly for macro-sensitive and highly leveraged companies such as banks, property and infrastructure stocks. Fortunately, the valuation of any business is largely insensitive to the next year’s dividends and investors should not lose sight of the main game.
Free cash flow is a better measure of value than dividends
Now, more than ever, traditional classifications of value based on accounting earnings and dividends are readily manipulated by management. The recent ramp up in dividend payout ratios and the growing divergence between statutory and “underlying” earnings are examples of this.
A sensible approach to dealing with this issue is to classify stocks based on their capacity to generate cash flow above that needed to sustain and grow their businesses (“free-cash-flow”). The use of free-cash-flow rather than accounting earnings or dividends is important because the measure is less readily manipulated by management and less readily observable by the market. This creates opportunities for investors willing to invest the time to assess free cash-flow, and the degree to which it deviates from accounting-based earnings.
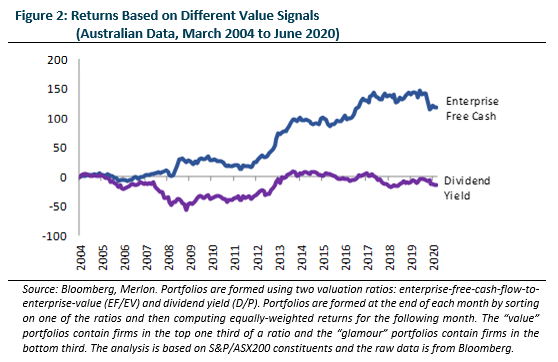
We wrote about the outperformance of a value strategy that classifies stocks based on free cash-flow rather than earnings or dividends in a three part series in 2017 (refer Value Investing –Part 1, Part II & Part III), with the key chart below.
Free cash flow, defined this way, also explicitly takes debt levels into account, a key consideration that is often overlooked by company directors.
Furthermore, dividends are often set by directors with respect to current operating conditions that might be inflated or depressed. Ultimately, the most relevant consideration is sustainable free cash flow and franking yield combined with overly pessimistic market expectations.
The long-term free cash-flow and dividend outlook is very attractive
The Merlon portfolio combines a view of value determined with reference to sustainable free cash flow after deducting debt in full, with overly pessimistic market expectations.
The broad-based equity market sell-off in February and March 2020 failed to recognise the extent to which certain equity sectors were either over or under-valued leading into the crisis. While market timing is difficult, this has created an exceptional opportunity to invest in a select group of stocks that are undervalued based on their capacity to generate free cash flow and pay attractive and sustainable dividends.
The companies Merlon invests have generally less debt, better cash conversion and more franking credits. This can be summarised in the below chart, highlighting the sustainable free cash flow yield of the share portfolio is 10.2% compared to the market at 6.7%.
We will elaborate on the outlook for dividends in the next section but note fundamental value is largely insensitive to the next year’s dividends. Rather, valuation is linked to the present value of free cash flow and franking credits, after debt has been repaid. It follows that any equity valuation is indifferent between dividends received or debt repaid, except for the time value of receiving dividends and franking credits slightly earlier.
The outlook for near-term dividends is weaker and difficult to predict
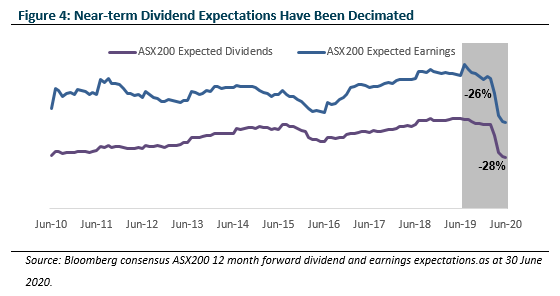
Notwithstanding free cash flow being a superior approach and the long-term being a more relevant consideration, many investors are understandably anxious about the near-term outlook for dividends. Market expectations for earnings and dividends have been dramatically impacted by the COVID-19 crisis and ensuing economic fallout, with one year forward dividend estimates 28% lower than a year ago and back to absolute levels last seen in 2010.
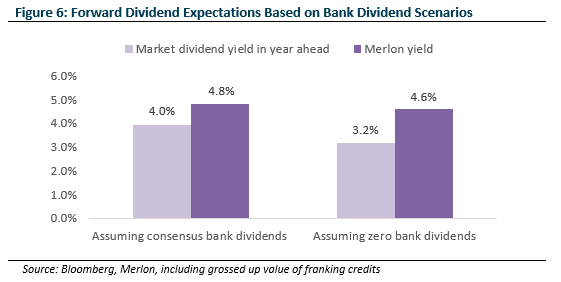
The key question is whether this outlook has already been priced in? For the optimists, the “pre-COVID” dividend yield, which assumes no permanent impact relative to the last twelve-months, is around 6% for both the broader market and the Merlon portfolio (see Figure 1). For the pessimists, the next twelve month or “COVID-affected” dividend yield, which assumes a permanent impact, reflects a much lower 4% for the market or 4.8% for the Merlon portfolio.
While there is some information content in these aggregate numbers, we don’t consider either to be useful in assessing long-term fundamental value. Given 90% of the value of a company is dependent on cash-flows beyond the next year, the focus should be on sustainable free cash-flow that funds the dividends. Furthermore, value should always be considered as a range of outcomes given the difficulty in predicting the future.
The dividend forecast range for any company is a function of:
- An assessment of the sustainability of current “advertised” accounting earnings;
- The conversion of these earnings into free cash-flow;
- Re-investment opportunities at an acceptable return on capital;
- The degree of financial leverage as excessive debt needs to be replaced with equity; and
- Tax considerations such as availability of franking credits.
National Australia Bank as an example:
The major banks comprise a large component of the market index and an outsized component of dividends. In 2019, for example, the major banks contributed 35% of the realised yield compared to the index weight of approximately 23%. While superficially attractive, the major banks are highly leveraged which poses problems in times of economic stress.
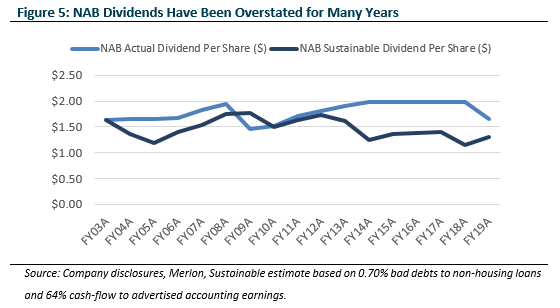
NAB’s “advertised” accounting earnings have been overstated in recent years as bad debts declined to unsustainably low levels and material “below-the-line charges” were booked. In addition, cash-flow was overstated due to subdued credit growth and the bank also gave up earnings from the US, UK and wealth divisions. Taking all of these adjustments into account, we estimate the sustainable dividend was on average 34% lower than the $1.98 actual dividend the directors clung to for the 2014 to 2018 period.
Estimating NAB’s dividend in the next few years is even more difficult given the high level of financial leverage. Starting with earnings, we estimate $9b cumulative bad debts in a mid-case downturn scenario (or 10x 2019 reported bad debts) and up to $25b in a severe downside scenario based on our interpretation of APRA stress results. For reference, consensus bad debt estimates are $9b to $10b, indicating market expectations are at least somewhat appropriate.
After absorbing bad debts, directors need to shift their attention to regulatory capital before declaring a dividend. For example, NAB’s own disclosures point to an equity capital shortfall of up to $8b in a severe downside scenario. Given current capital of $45b has to support a $614b loan book, it is no wonder overseas regulators and APRA are pressuring banks to limit dividend payouts until the COVID-19 economic fallout and recovery can be better understood.
High levels of debt present the greatest challenge forecasting near-term dividends and the share portfolio is significantly underweight leverage by virtue of its immaterial holdings in banks, infrastructure and property. While we assume some dividends for banks in our central case, these are below market, and a downside recession scenario of zero bank dividends for the next 12 months would reduce the market yield by 0.8% but the share portfolio’s yield by only 0.2%.
Telstra as an example:
Last year we wrote how Telstra could be worth between $1.80 and $4.50 based on a range of sustainable free cash flow scenarios, with the risk skewed towards the lower end (Telstra Investment Case). Telstra’s dividend per share in the last 12 months was 16 cents which some observers use to derive a simplistic valuation of $4 (16c @ 4% yield).
As illustrated in Figure 7, Telstra’s earnings per share can be decomposed into four categories:
- One-off NBN disconnection receipts (9.7c per share as disclosed by Telstra)
- Restructuring charges and impairments (-6.8c per share as disclosed by Telstra)
- Fixed line EPS, trending down (4.8c estimated by Merlon)
- Underlying EPS ex fixed line (9.5c, the residual)
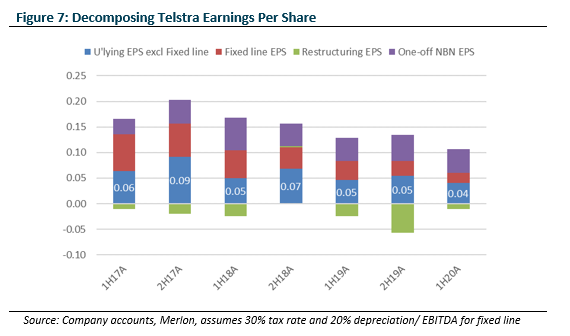
To the company’s credit, Telstra does disclose 6c of the 16c dividend as an unsustainable special dividend, representing one-off NBN disconnection payments net of NBN cost to connect charges.
However, even if investors give management the benefit of the doubt and assume NBN cost to connect won’t be recurring and ignore persistent restructuring charges, they are left with somewhere between 9.5 and 14.4 cents earnings per share depending on their view on the ultimate profitability of fixed line EPS (reselling commoditised NBN replacing current “copper earnings”). Applying a 70% payout ratio would yield a dividend per share range of 7 to 10 cents per share (or simplistic valuation range of $1.70 to $2.50 capitalised at 4%).
With Telstra’s 16 cent dividend per share contributing a not insignificant 4% of the market’s next twelve-month dividend yield, this is an important debate for investors to have.
Merlon Australian Share Income Fund Distribution Outlook:
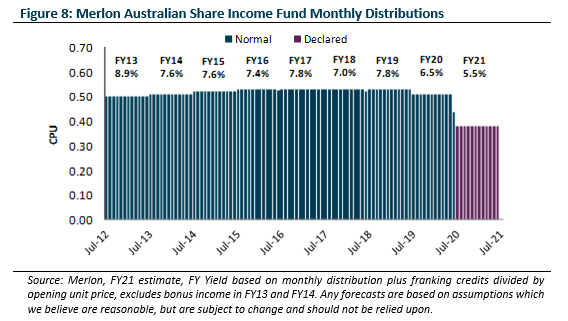
In addition to long-term capital growth above inflation and lower risk than the market, the Merlon Australian Share Income Fund (Fund) targets a higher distribution yield than the market. As Figure 8 highlights, this yield has also been consistently distributed on a monthly basis since 2012.
While the COVID-19 crisis will pass and Australia appears to be in a relatively strong position, predicting near-term dividends given the economic dislocation is difficult. As a result, we have adopted a conservative approach and reflected this economic event by reducing the monthly income guidance to 0.38 cents per unit, a 25% reduction relative to the past 12 months and slightly better than the 28% reduction for the broader market (Figure 4). The new guidance represents a premium distribution yield of 4.7% at the 30 June 2020 unit price, or 5.5% including the grossed up value of franking credits.
This yield is above market and importantly, is less exposed to the highly leveraged banking sector, Telstra’s unsustainable fixed line earnings and the macro sensitive iron ore miners.
As evidenced in Harvey Norman and Nick Scali’s recent reinstatement of their dividends, there is upside to the yield in the event of a “V shaped” economic recovery. In a more protracted downturn scenario, there is downside risk to the dividends but this could be offset by additional income from the downside protection overlay.
Importantly, the sustainable grossed up dividend yield of over 7% and free cash flow yield over 10% (see Figure 1) underscores the long-term opportunity for capital growth and higher dividends which the Fund is exposed to, with a 30% lower risk profile than the market.
Conclusion:
As highlighted through 16 years of data (Figure 2) and demonstrated with the National Australia Bank and Telstra examples, investors cannot rely on last reported dividends to value companies as these dividends might not be sustainable. Also, it is very challenging forecasting the next year’s dividends during economic downturns, particularly for highly leveraged companies.
However, while the outlook for near-term dividends is weak and difficult to predict, investors should not lose sight of the main game. The long-term opportunity for capital growth and sustainable franked dividends from a contrarian cash-flow based investment strategy, such as the one employed at Merlon, is as attractive as it has been for some time. Patient investors could be rewarded along the way with above-market, majority-franked distributions and 30% downside protection from the hedge overlay.
Author: Neil Margolis, Lead Portfolio Manager