
Good Companies Not Always Good Investments
In this paper we consider the merits of systematically investing in “high quality” companies. We conclude that:
- Not all traditional “quality” factors have outperformed over a full market cycle, with the performance of both “high growth/return” and “low volatility” stocks mixed. That said, certain “quality factors” have outperformed since the global financial crisis
- Performance of certain quality factors have coincided with falling interest rates, a trend unlikely to persist indefinitely and at risk of retracing over longer time horizons.
- Traditional quality factors are currently expensive, with baskets of “quality” stocks trading at historically high earnings premiums to the broader market
At Merlon, we do not “screen” based on “quality”. In a subsequent paper, we will outline how Merlon’s assessment of quality impacts our view of sustainable free cash flow and analyst conviction, which in turn drives investment decisions.
The pursuit of quality
Investing in “quality” companies has been a commonly cited phrase in the investing community over the past few decades. There is no better person to encapsulate this transition from traditional “cigar-butt” value investing to a preference for quality, than Warren Buffett who stated “It’s far better to buy a wonderful company at a fair price than a fair company at a wonderful price”. We would note however, that this shift is somewhat driven by limited value opportunities relative to Berkshire’s meaningful scale.
A key question remains: what distinguishes a “quality” company from its more average peers? Anecdotes we have often heard include
- High quality, shareholder aligned management with proven track record
- Dominant market positions and strong barriers to entry
- High return on capital and attractive reinvestment opportunities
- Low earnings and stock volatility
- Stable and growing earnings
- Strong, defensive balance sheet
We agree that these are desirable attributes for a company to have. It would also not be difficult to build a portfolio of companies with these characteristics (as subjectively, most companies have a few).
However, as investors searching for mispriced businesses it is more important to consider the appropriate premium to pay for “high quality” attributes. If these “quality factors” are not systematically mispriced, owning “high quality” companies will not contribute to superior long- term returns.
Post-financial crisis “quality” investing
The pervasive market view over the past 10 years has been the outperformance of companies with high quality attributes and strong growth. In the US, we have seen this trend encapsulated by the FAANGs (Facebook, Apple, Amazon, Netflix, Google). Closer to home, we have seen multiples expand above historical levels for companies that are
- High growth, high return on capital*: Companies that are growing quickly and reinvesting profits into further growth at a high return-on-capital. Represented largely by globally exposed healthcare, online digital platforms, technology and semi-regulated
- Defensive, low volatility**: Companies considered “safe” due to low earnings risk, stock volatility and historical market sensitivity. Largely composed of stocks in the healthcare, infrastructure, real estate investment trusts (REITs), consumer staples and bank
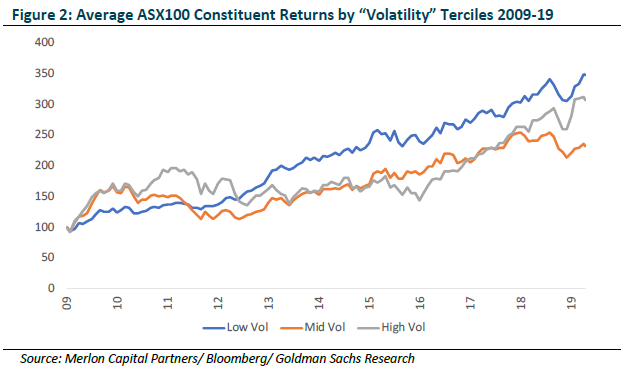
We agree that stocks in the defensive, low volatility basket have outperformed since the global financial crisis in 2008/09 (Figure 2).
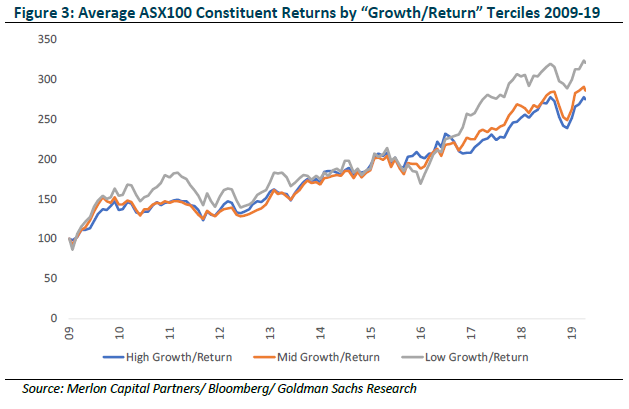
Using an equally weighted index, the average “high growth/return” stock however has underperformed over the same period, contrary to general views (Figure 3). We highlight that because the general market looks at the market cap-weighted index, the outperformance by a small number of large cap “high growth/return” stocks have skewed the misperception that the “growth/return” factor has outperformed in the ASX100 over the past ten years.
Increasing overvaluation
“Pursuing quality regardless of price is, in my opinion, one of the riskiest – rather than safest – of investment approaches” – Howard Marks
Historic performance is one thing but as forward-looking investors, we remain cautious on “high growth/return” and “low volatility” as proxies for quality investing, given the valuation premium ascribed to these stocks is high in a historic context. This highlights the share price gains that have not been supported by underlying earnings.
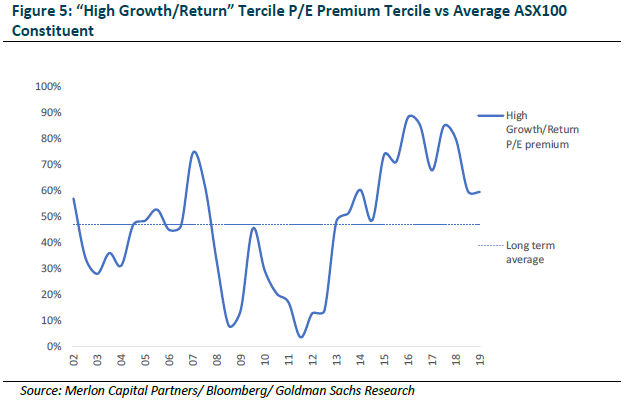
We argue that in the post-GFC environment characterised by low interest rates, inflation and macroeconomic growth, investors have clustered within these “quality” stocks.
Low interest rates a contributing factor
We would argue that the ongoing reduction in interest rates has increased demand for perceived high-quality companies. Anecdotally, traditional fixed income investors have been increasing equity allocations while attempting to minimise additional risk. Likewise, the premium for companies growing at above average rates have benefitted from lowering of discount rates.
The lower interest rates go, the more sensitive valuations become to further reductions (or increases) in discount rates as opposed to changes in underlying cash flows.
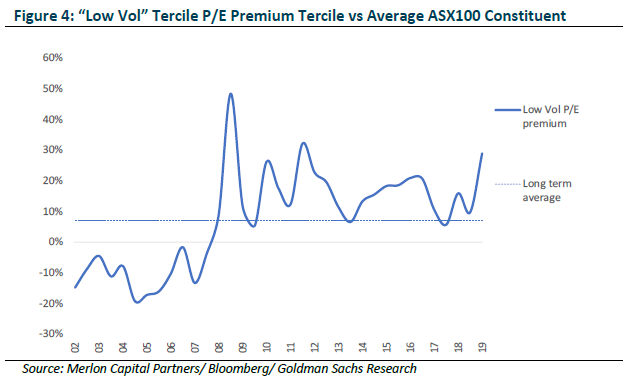
We can observe this by examining the relationship between long-term government bonds and the valuation premium (Figure 6).
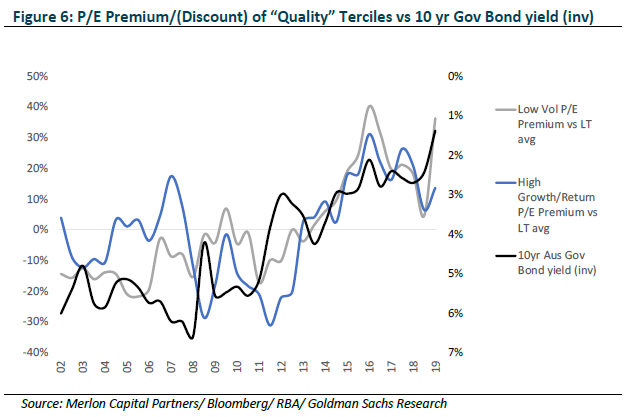
We struggle to believe that real interest rates will remain negative indefinitely. Reversion of real interest rates upwards towards long term averages highlight the significant downside risk to these lofty valuation premiums for quality.
Investing in quality less compelling over the long term
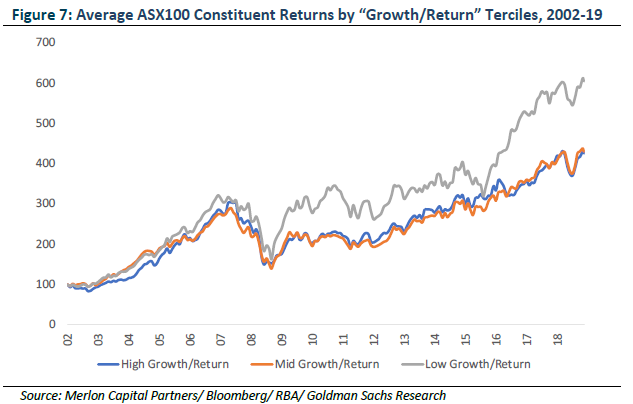
Ultimately, when we look at the long term evidence of whether certain definitions of “quality” warrant merit as a factor reflecting systemic bias in market pricing, the results are somewhat mixed. Over a full market cycle, the performance of both “high growth/return” and “low volatility” stocks have been mixed.
The average low growth/return stock has vastly outperformed the average high growth/return over a 15 year period (Figure 7). This is consistent with Merlon’s prior research (Value vs Glamour) which highlights the market’s bias in overpaying for high growth “glamour” stocks whilst avoiding low or declining growth companies that are behaviourally uncomfortable to own or justify to clients.
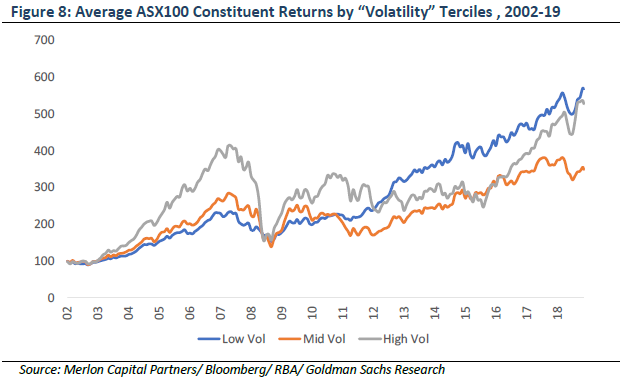
While the average “low volatility” stock outperformed over both the long run (2002- 2019) and post the GFC, this performance is largely matched by the “high volatility” stocks. Therefore, there is limited effectiveness in the volatility factor due its mixed performance.
Conclusion
“Even the world’s greatest business is not a good investment, if the price is too high.” Lou Simpson
The market often has a short memory. It is easy to look back at the ten-year bull market and conclude that owning “high quality” companies is an easy route to investment outperformance. Yet there is little evidence that this strategy, in isolation, works over the long-term and through the fluctuations of the market cycle.
Additionally, as the market crowds into these stocks, their premium to market’s multiple has risen to historically high levels. At the current point in the “quality premium” cycle, we are inclined to believe that these premiums should revert downwards to long-term averages over time.
At Merlon we do not “screen” based on “quality”. In a subsequent paper, we will outline how Merlon’s assessment of quality impacts our view of sustainable free cash flow and analyst conviction, which in turn drives investment decisions.
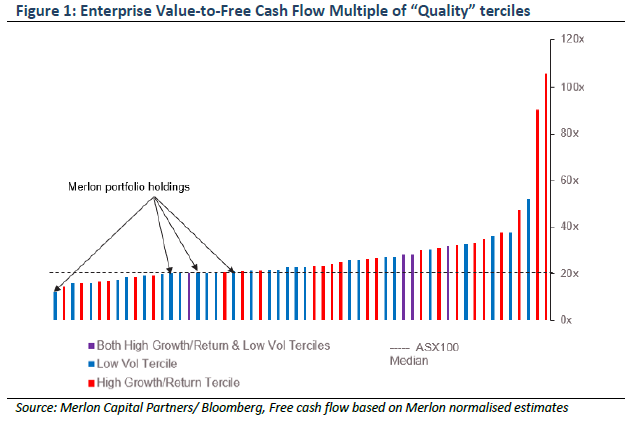
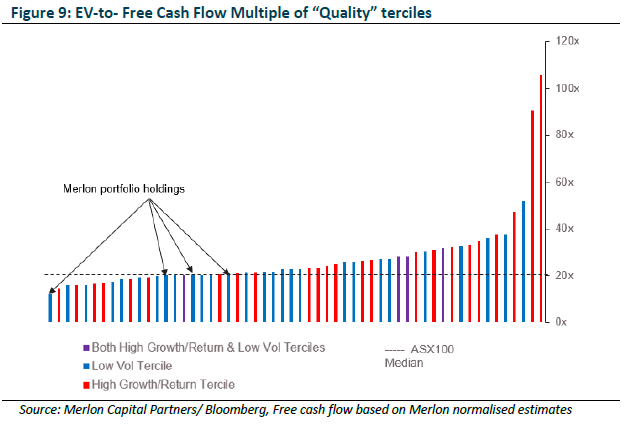
The chart below highlights the large premium enjoyed by most “high growth/return” and “low volatility” stocks even on a forward-looking normalised free cash flow basis. We do own a handful of “quality” companies defined this way, but only because they offer valuation upside and we have conviction that market concerns are overly discounted into the current share prices (Figure 9).
Considering the premium paid for “quality” attributes at present is well above historic norms, buying into “quality” runs a real risk of paying for good businesses but ultimately, making poor investments.
Author: Joey Mui, Portfolio Manager/Analyst
* As measured by FY1 EBITDA Margin, ROE over FY0 & FY3, Sales & EPS Growth; 3yr Historical + Forward
** As measured by Historical beta, FY1 consensus EPS dispersion , 2-month share price volatility, Market cap