
Trade war – winners, losers and…is it over?
Key points
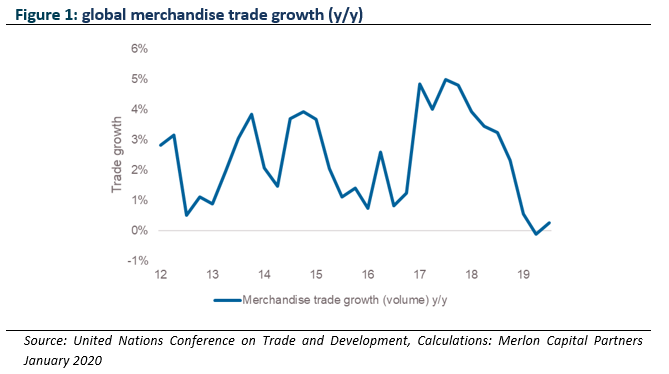
- Trade war risks appear to be easing: A 15 January official signing of the phase 1 trade agreement could signal the end of the escalation phase of the trade war, and lead to an unwind of the notable commodity trends seen over the period.
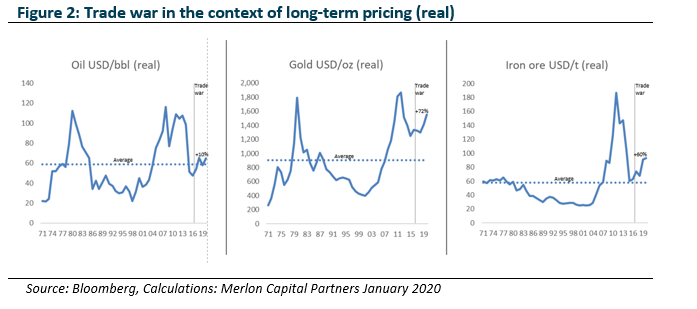
- Longer-term dynamics are unaffected: While the trade war has had a negative impact on trade activity, commodity performance has been largely overwhelmed by supply issues. Yet our long-term gold, oil and iron forecasts are unchanged.
- Gold: Due to its role as an alternative currency, gold has benefited from the US Federal Reserve’s (Fed’s) cushioning policy stance. The performance of gold is expected to revert towards long-term averages as the Fed reverts to its prior ‘normalisation’ process.
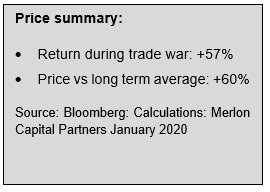
- Oil prices are expected to be supported at higher levels: Oil has been flat over the course of the trade war, yet the rise of capital discipline in US shale is expected to support prices at or above long-term averages.
- Iron ore prices are elevated any way you look at it: The impact of the trade war on iron ore has been more than offset by supply disruption. Pricing should continue to revert as supply returns.
The Merlon process and commodity stocks
At Merlon, we believe people are generally motivated by short-term outcomes, overemphasise recent information and are uncomfortable having unpopular views. Our process is aimed at ensuring we minimise our exposure to these behavioural biases and exploit misperceptions about risk and future growth prospects.
The first step in our process is determining sustainable free cash-flow, with reference to qualitative considerations, macro and cyclical considerations and financial returns with as long-term and historic context as possible.
Commodity exposed stocks generally fare poorly in terms of undifferentiated product, high capital intensity and pro-cyclical capital allocation track record. In 2018, we argued a quick resolution to the trade war was unlikely, but the more important driver was unfavourable long-term supply / demand dynamics in our most critical export, iron ore.
The second step is to determine an unbiased and consistent measure of value based on sustainable free cash flow and franking, net of debt. This allows us to determine whether there is some chance other investors have become too concerned (or complacent) about risks and growth.
We then shift our focus to conviction, which recognises that to be a good investment, we need evidence that the market’s concerns are either priced in or invalid. One way we determine whether the market is overly pessimistic is to produce valuation scenarios focused on the risk of permanent capital loss relative to the best case or upside scenario. Again, commodity exposed stocks are well catered for in our process given the undifferentiated product and the long-term historical context available to assess a range of plausible valuation outcomes.
The trade war background and context
In the context of Merlon’s process, the trade war did not impact our assessment of sustainable free cash-flow or unbiased long-term value for commodity-exposed stocks. However, it did present downside risk to economic growth and might have resulted in higher conviction if investors became overly concerned and commodity prices sold off from their elevated starting point. This did not prove to be the case for reasons we will explain later.
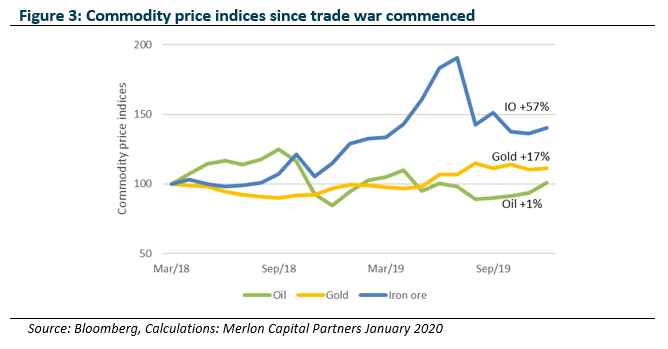
President Trump rewrote the geopolitical narrative with his April 2018 declaration of tariffs on USD50b of imports from China. Since this time, we have seen an escalation phase, which only ended in mid-December. While the effect on commodities was broadly expected to be negative, we have seen significant divergence across the major industrial, energy and precious metal markets. 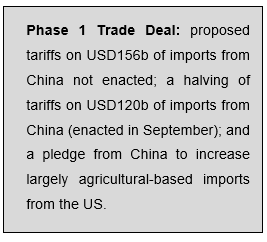
The December trade agreement, if confirmed at the stated 15 January ‘official signing’, would signal the end of the escalation phase of the trade war. The confidence this gives the global economy, coupled with the lower ‘cost of trade’, could see increased economic activity. Given the trade war was characterised by declining bond yields and oil prices, and rising gold prices and the USD, it is reasonable to expect some reversal of these trends. This could accelerate should the ‘phase 2’ talks prove productive.
Gold: what are you buying?
Trade war impact: The trade war has had the most direct impact on gold, with Trump pressuring the US Federal Reserve into a more supportive monetary policy stance, to counteract the negative impact from the trade war. By lowering the opportunity cost of holding gold, measured in terms of the real risk-free rate of return (US treasury yield less inflation), gold has appreciated.
Longer term considerations: Gold is held for different reasons through time, rendering forecasts inherently unstable. Forecasting is complicated by the fact that gold has no yield to reward holders for risk, and hence possesses no inherent value on its own.
Demand for gold in 2018 was 4,400 tonnes. Of this, fundamental demand (primarily jewellery) accounted for two-thirds of demand, while non-fundamental demand (gold bars and coins, exchange traded funds, and central bank buying) accounted for the remaining third. Non-fundamental demand is more than three-times the levels of the early 2000s.
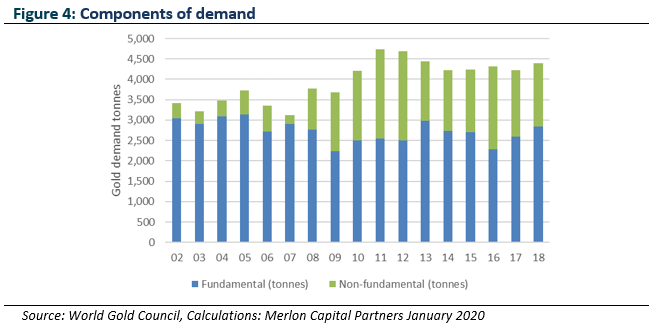
Non-fundamental demand for gold is considered speculative, as gold does not produce cash flow from which to value it. It is reliant on being able to sell it to someone else in the future at a higher price in order to generate a return. Estimating this non-fundamental component tends to be poorly defined, with a range of factors identified as potentially driving demand.
The risk in relying on this non-fundamental component of demand is that when monetary policy normalises, and the global economy proves it is robust in the process of normalisation (a process recently interrupted by the trade war, as previously noted) then this demand may become supply as the reasons for holding gold dissipate. The accumulated tonnage of post GFC non-fundamental demand represents more than five years of fundamental demand, and should be thought of as latent supply, should the prevailing views change.
Given these risks, it is worthwhile seeking to understand the nature of this non-fundamental component. As a framework for assessing these non-fundamental factors, gold can be thought of as a zero coupon, non-sovereign risk exposed bond. To this end, the appeal of gold is a function of its relative appeal to competing investments, namely sovereign bonds, based on yield, inflation protection and risk of repayment. Each of these elements is discussed below.
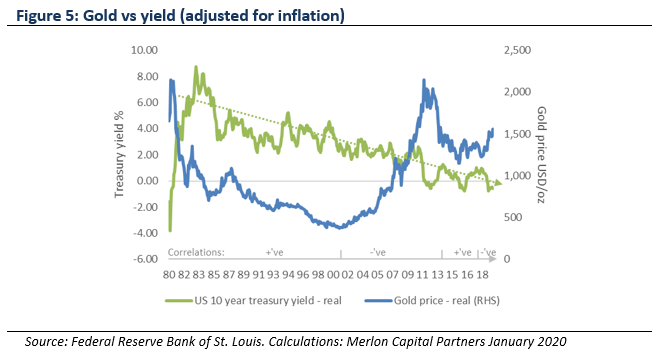
Yield: Recently, the dominant narrative for holding gold is the decline in real yields available on benchmark risk-free assets, namely the 10-year US Treasury bond. The argument in favour of holding gold is that the lower the interest rate available on US Treasuries, the more attractive a zero yielding alternative risk-free asset such as gold.
While this argument has played out over the short term, particularly as real bond yields have gone below zero, for most of the period under analysis, the gold price declined at the same time as real yields. In this sense, the ability to rely on this relationship is tenuous.
Inflation protection: Inflation erodes the value of savings, with gold’s apparent scarcity making it seem a useful hedge against inflation. This effect is clear when comparing gold with oil, historically a key driver of inflation.
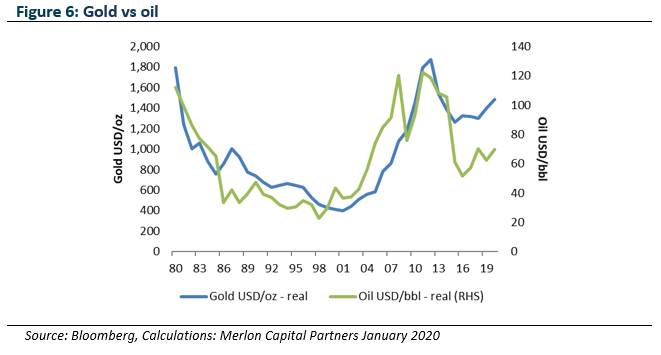
Oil and gold represent a much stronger relationship than that between gold and real yields. While the linkage between oil and gold dislocated in 2014, as the surge in US supply from unconventional sources (discussed below) surged.
Over this period, gold prices have become negatively correlated with real interest rates (rather than positively as they had been for several decades). This is in part due to the opportunity cost of holding gold being lower.
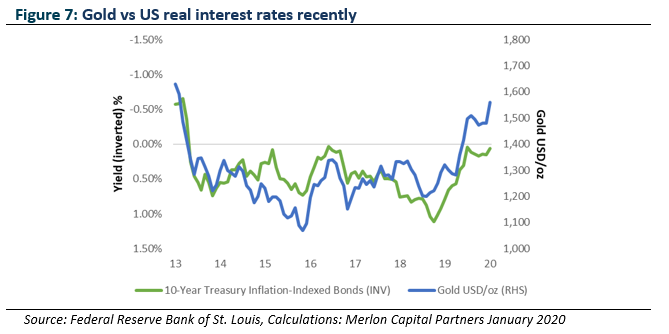
Yet this relationship is still relatively new, and brief in the context of longer-term analysis. And with gold already looking expensive on this basis, and relative to oil as noted, the risks are growing that should interest rates begin to normalise on easing trade tensions, gold could retrace.
Counterparty risk: While gold can be thought of as a type of nil-coupon bond, the counterparty is the market rather than a sovereign, with the principal being the price paid. Unlike a bond, there is no fixed maturity or amount receivable upon maturity. A holder of gold is at the mercy of the market’s pricing of gold at the time of selling.
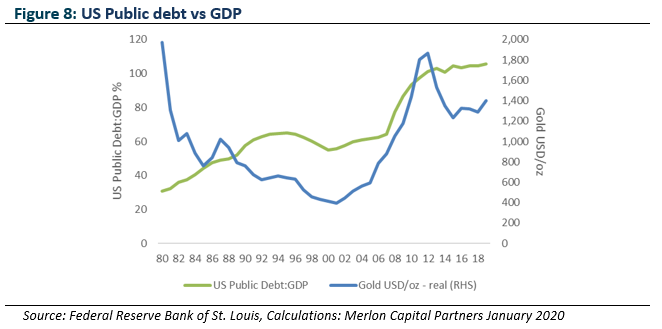
That said, with the counterparty to US treasuries becoming increasingly indebted, the appeal of gold’s counterparty risk is evident. Gold’s appreciation is consistent with the rise in US government debt following the GFC. Again, however, this relationship is not a constant one. Should the Fed return to its process of monetary policy normalisation, the arguments for holding gold reduce.
Gold as a currency: People buy gold as if it were a currency, or directly exchangeable as a currency (as it had been for many years prior to the creation of fiat currencies), if they expect the value of their own currency to decline (due to a rise in the prices of goods and services, or due to a rise in the supply of that currency seen throughout the phase of Quantitative Easing policy).
Printing money in excess of the growth of an economy reduces the value of a unit of that currency, making the price required for goods rise to compensate. This was the theory behind Quantitative Easing. Except inflation did not eventuate (or maybe it warded off deflation). Yet the value of the USD as measured by other currencies, has yet to fall.
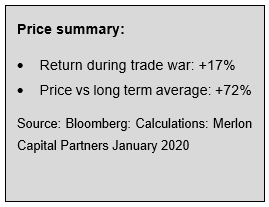
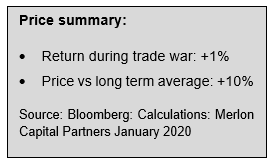
Conclusions: Our philosophy recognises people tend to over-extrapolate recent conditions. Gold is currently trading 72% above its inflation-adjusted long-term average, so on face value it is difficult to have high conviction that prices will rise further. Gold’s strong recent linkages to real interest rates on risk free assets provide the best guide to the short-term outlook. Should we see the negative effects of the trade war reverse, and the Fed’s accommodative interest rate policy unwind, then gold’s outperformance should reverse. Gold’s inflation protection role is also a factor, should inflation re-emerge, yet gold is trading well above long term averages. As we will see, oil may prove a better exposure to inflation given its role in the global economy, and the structural factors that may support pricing.
Oil: capital discipline
Trade war impact: The negative impact of a trade war between the world’s two largest economies should have been negative for oil, which has historically been highly correlated with global trade activity. And in terms of demand the effects have been consistent with this expectation, with the International Energy Agency revising 2019 demand growth forecasts down from 1.5mbpd to 1.1mbpd. Yet President Trump’s decision to re-apply sanctions on Iranian exports just a month later lent support to pricing, albeit with the market remaining well-supplied via additional supply from Saudi Arabia and Russia, coupled with continued production growth from the US.
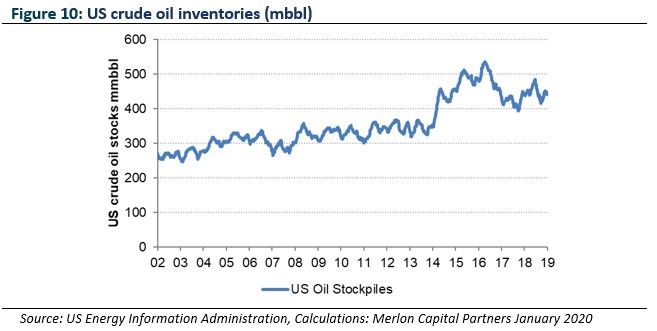
Longer term considerations: In short, the oil market has remained pressured by continued supply growth from the US, as the chart below demonstrates. The US has doubled in five years to be the largest producer of oil and associated liquids and has been the most dominant trend in the market over the past decade.
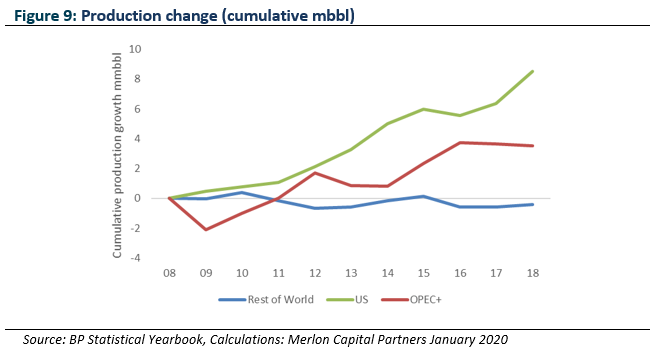
This rapid growth effectively swamped the US market, leading to a large inventory overhang. In the absence of capital discipline within the US, the response of dominant global producers, most notably Saudi Arabia, was to reduce their own output in order to support pricing, with the objective of enabling the US stockpile to be drained, at least back to their five-year average levels.
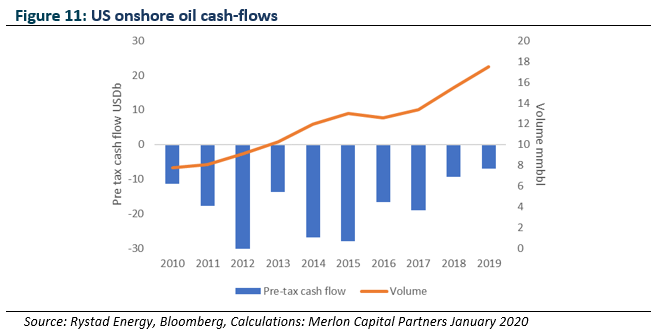
Most importantly for the global market for oil, the ability of the US shale producers to maintain this rate of growth appears increasingly limited, with persistently negative cash-flows leading to declining access to capital to fund further activity. The cash flow from a barrel of shale oil is lower than conventional oil due to significantly higher depletion rates (80% of unconventional oil is depleted in the first 2-3 years).
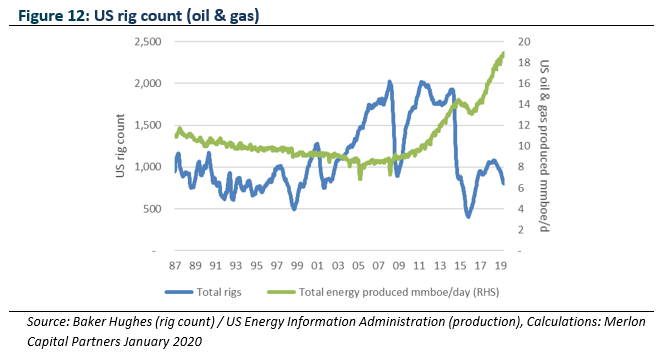
The effect of capital discipline is reflected in the below chart, which shows the effect on rig activity. Production has continued to grow following a focus on the most productive plays (effectively high-grading production), yet we expect this substantial decline in activity to ultimately flow through to a peak and potentially declining production. This scenario will be supportive for oil and gas pricing globally.
Conclusions: As noted in the section on gold, we believe oil may prove a better exposure to inflation given its role in the global economy, and the structural factors that may support pricing. We also see the downside risks as being lower, with oil trading only 10% above long-term average levels. With the US being the largest producer of oil and liquids globally, and having dominated production growth over the past decade, the effects of capital discipline in a cash-losing segment are likely to be supportive of prices. Further, the effects of the trade war de-escalation may also result in increased demand growth.
Iron ore: disruption reversing
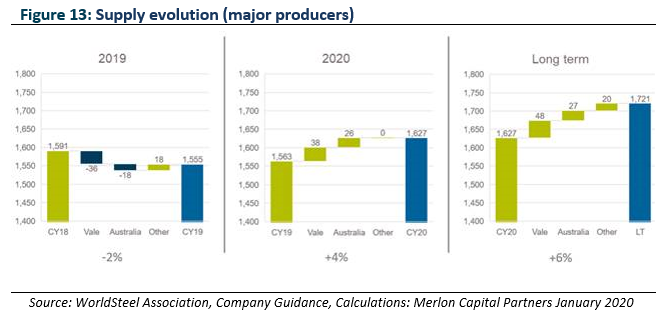
Trade war impact: Iron ore is perhaps the commodity least affected by the trade war. While global steel production (excluding China) has experienced an average -2% growth rate, consistent with the effect on oil markets, China bucked the trend with an average of 7% growth, albeit having recorded a negative year on year growth in October. The net effect on demand has been consistent with oil markets with continued growth, but at reduced rates. Also consistent with oil markets over the trade war escalation phase is the dominance of supply factors, with the key driver of iron ore price being the disruption experienced by the world’s top supplier Vale.
Supply considerations: Supply growth seems set for more than recovering the outages experienced in 2019, with long term production from the majors 8% higher than levels of 2018, based on recently stated production targets.
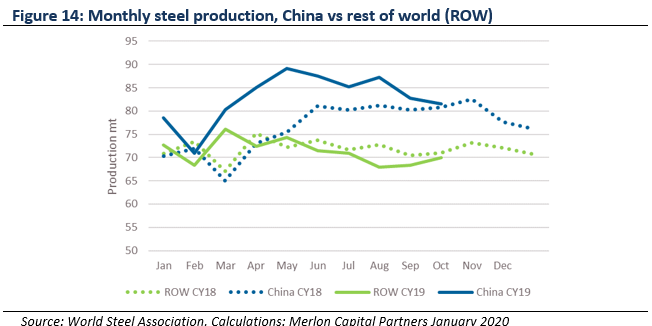
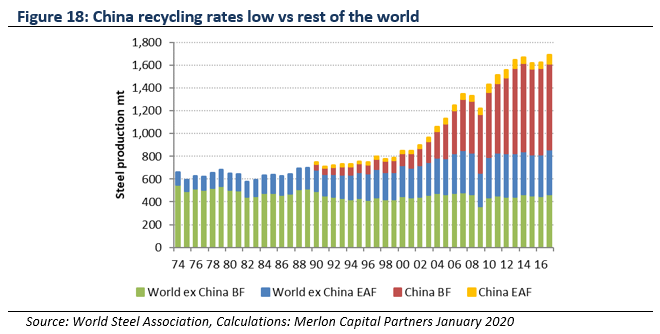
China’s steel production in the first half of 2019 was driven by strong 2018 steel spreads following the closure of ‘illegal’ induction furnace recycling capacity. Yet the chart below shows that this growth may now be tailing off as the effects of oversupply impact producers’ ability to sell product. Importantly, it appears that 40% of this growth came via recycled steel, evidence of the growth of recycling within China. Production outside of China is down 2% vs pre trade war levels. Should production continue to follow these trends, the stated iron ore production growth from major producers looks set to push the market into surplus.
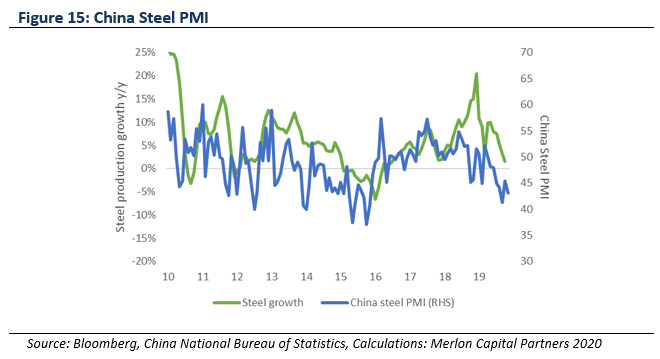
Yet this growth is clearly excessive, particularly when looked at in the context of the health of the steel industry, as measured by the Steel Purchasing Managers Index (PMI) index. This index shows that while steel production has grown strongly, it has done so in the absence of demand, leading to poor conditions.
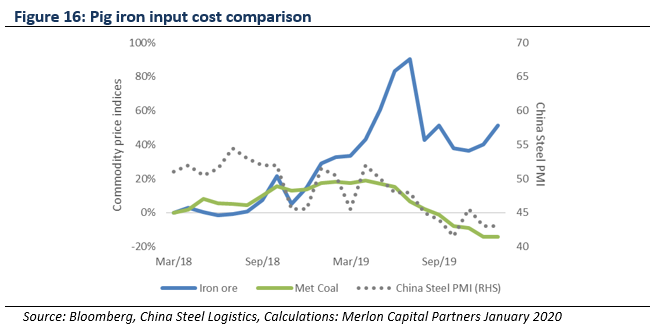
The comparison of met coal and iron ore pricing shows that the underlying fundamentals for the steel market may less bullish than that implied by iron ore pricing. While the metallurgical coal market is also exposed to the deteriorating ex-China steel market, its trend remains consistent with China’s steel PMI data, which is noted as deteriorating due to excess production.
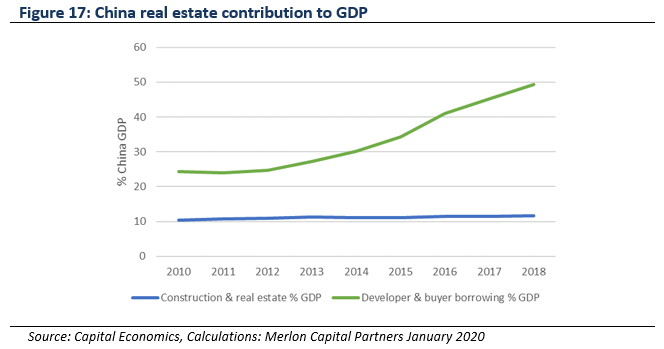
Demand indicators: The contribution of property to the Chinese economy has been stable at 10% since 2010. Yet over this time debt levels have doubled, indicative of unproductive investment in this sector – a feature emphasised by the greater-than-20% vacancy rate. As a key driver of steel demand in China, the growing risk in this sector is a key issue.
Substitution risk: On a longer-term basis, if China’s dedicated recycling rates transition to reflect more mature markets, then the displacement of iron ore from the steel market could be a further negative factor.
Conclusions: With iron ore, a non-scarce resource globally, trading 82% above its normal level, the downside risks are clear. Vale, being the key driver of supply disruption, is roughly half-way through restoring volumes. China, having been supportive of global demand over the course of 2019 following the positive margin effects of supply side reform, is now at risk of having to reduce the production of steel, seen in recent production data. On a longer-term basis, there is further downside risk from the maturation of its steel industry driving higher rates of recycled steel, and lower usage of iron ore in making steel.
Implications for investors
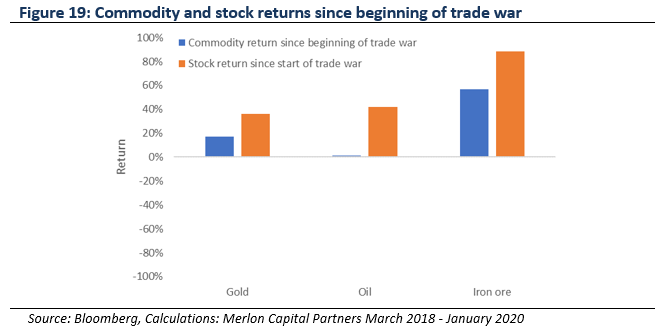
While the trade war has dominated the media, iron ore and oil have been more driven by supply side factors. Gold has had the most direct exposure to the trade war given the use of monetary policy to cushion some of the contractionary effects of the dispute. Stocks have exhibited a range of leverage to these commodity price changes, as well as stock specific factors. Oil exposed stocks have been skewed by the corporate interest in Santos over the period, up on average 23% excluding this.
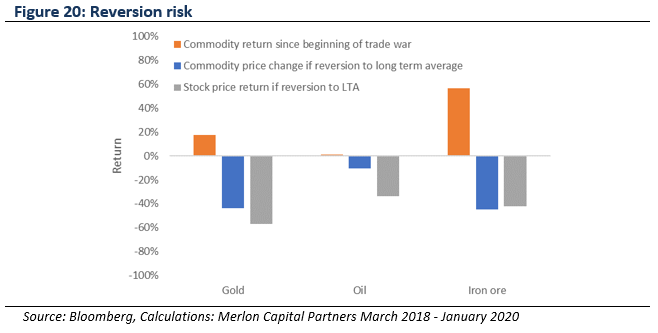
Most pertinent at this stage is to understand the reversion risk should the trade war shift to a ‘de-escalation’ phase following the Phase 1 agreement. Gold is the most exposed to this given it has been far more directly exposed as noted. Prior to the trade war, the US Federal Reserve had been seeking to normalise policy, with gold prices impacted. Higher global confidence and trade activity would enable the Fed to re-attempt this normalisation.
Merlon positioning
We are long term investors and are positioned on the basis of sustainable cash flows, which are in turn a function of sustainable commodity prices. The starting point for sustainable pricing is where commodity prices ‘usually’ trade, calculated as the long-term average price, adjusted for inflation. Structural factors supported by evidence may be overlaid, such as the peaking of US oil production (the largest oil producer) or the shift towards steel recycling in China (the largest iron ore consumer). Following is a summary of positioning with respect to the commodities noted in this paper:
Gold: With gold 72% above its long-term average, and hence at seemingly unsustainable levels, there is significant downside to our valuation of gold miners. As such we currently have no exposure to this sector. Importantly, even using spot pricing there is an average of ~30% downside in this sector. There are ways to increase the valuation, through using a lower discount rate, a common argument used to justify a higher valuation for gold miners. Yet, even if you believe gold is a risk-free asset, a gold miner has operational and financial risks that do not relate to gold. Further, gold miners are net sellers of gold – they do not hold the asset once extracted. As such, we adhere to our disciplined long-term investing approach.
Oil: Oil is currently 10% above its long-term average, yet we know a proportion of US shale oil and gas producers are not generating positive cash flows, after capital expenditure required to maintain production. As capital discipline continues to emerge and capital expenditure declines, production should respond. This would be supportive of global oil prices and Australian companies leveraged to this. Merlon currently has exposure to both Origin Energy and Woodside Petroleum.
Iron ore: Iron ore is currently 60% above its long-term average, implying prices are trading well above sustainable levels. With continued iron ore volume recovery as guided by Vale, as well as growth from BHP and RIO, we see supply tightness continuing to loosen. Over the longer term, we also expect to see iron ore displaced as Chinese steel recycling rates increase – a well-accepted path in maturing steel industries. Given these risks, we do not hold iron ore producers.
Implications for consumers
Petrol: peaking US production and geopolitical tensions could mean upside risk
The most significant driver of the price paid by consumers is the crude oil price, which in recent years, has been affected by the surge in production from the US.
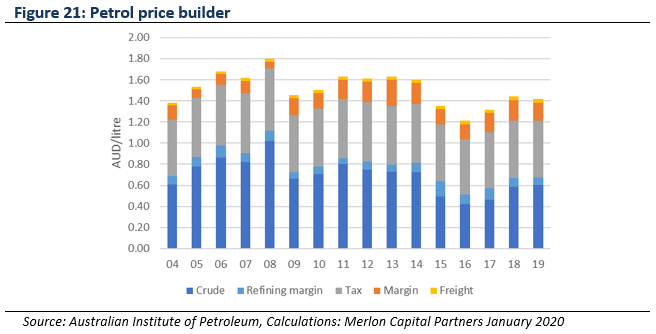
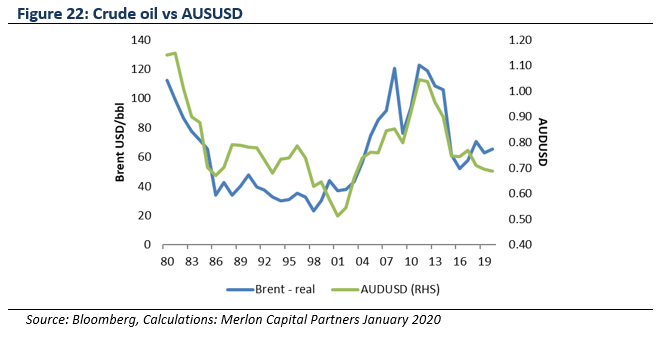
However, the correlation between oil prices and the Australian dollar has been reasonably strong over the long term, serving to dampen the volatility of the underlying oil price. This is because of the common linkage between global demand for oil, and in turn, demand for commodities more generally, of which Australia is a dominant producer.
However, should US oil production begin to decline – an event independent of global demand and hence the Australian dollar – then higher crude oil prices may not be dampened by the currency, feeding directly through to pump prices.
Electricity: growing renewables contribution sees downside risk to prices
Wholesale electricity pricing increased strongly in 2017 following the closure of the large-scale coal-fired Hazelwood plant in Victoria. This closure of baseload generation created a tighter market for electricity and hence, higher prices.
This tightness has begun to unwind, with the growth in renewables capacity. Renewables now contribute 25% of electricity supplied, nearly twice the level five years prior. It is expected that renewables will continue to form a larger part of the electricity mix as further capacity is commissioned.
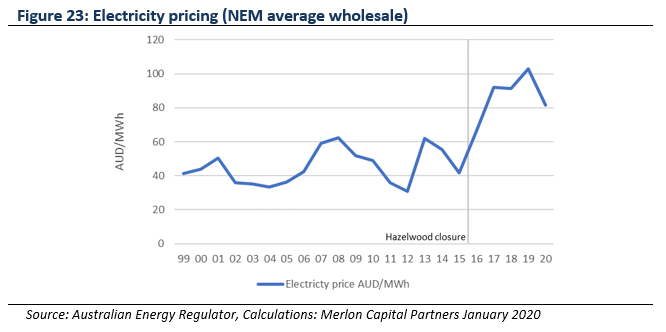
With more renewable energy comes greater intermittency of generation due to variable weather patterns. This is addressed through greater usage of gas-fired peaking plants, which effectively ‘fill the gap’ of this intermittency, and hence form the marginal cost producer and price.
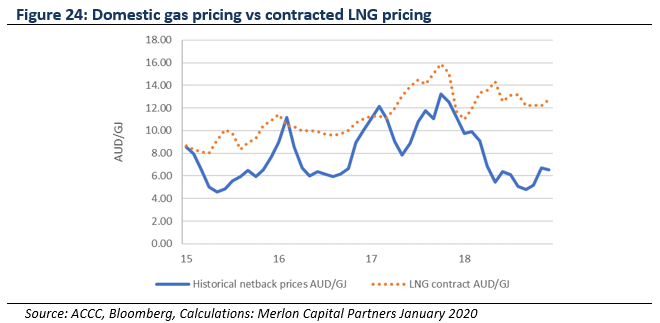
Domestic gas prices are increasingly influenced by ACCC-calculated LNG ‘netback’ pricing (the price received by an LNG exporter in the spot market, less the cost of freight and liquefaction).
While initially gas prices spiked significantly as LNG production in Queensland was commissioned from 2015 onwards, there is now downward pressure on netback pricing, due to an oversupply of spot (non-contracted) LNG cargoes in the region. This is expected to flow through to lower wholesale electricity pricing, albeit typically lagged due to hedging activity. This pricing effect may be exacerbated by renewables capacity growth.
Savings: is gold a solution for low interest rates?
To complete the picture from the other side of the ledger, the ability to generate investment income to pay for these basic commodities has been complicated by declining interest rates. Income from term deposits has basically halved in just five years.
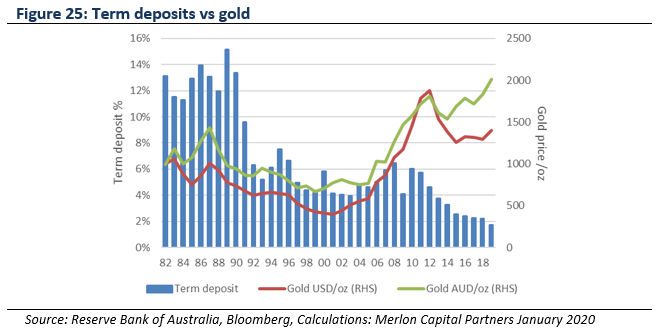
Some argue that with rates so low, gold becomes more attractive. Yet, a term deposit continues to offer income, relative to the guaranteed zero income provided by gold. To roll a term deposit into an investment in gold, therefore, an investor must implicitly expect the gold price to rise – this is the classic definition of speculation: buying something with the expectation of being able to sell it for a higher price. It is true that gold prices have been rising, however, the negative correlation with declining interest rates is not a consistent relationship through time and not necessarily reliable in future.
Author: Ben Goodwin, Analyst/Portfolio Manager