
Oil: The Cycle Continues
Over the period since Merlon’s establishment in 2010, oil prices have traded between USD40 per barrel (bbl) and USD120/bbl, a period representing the end of an oil boom, and the beginning of an era of consolidation.
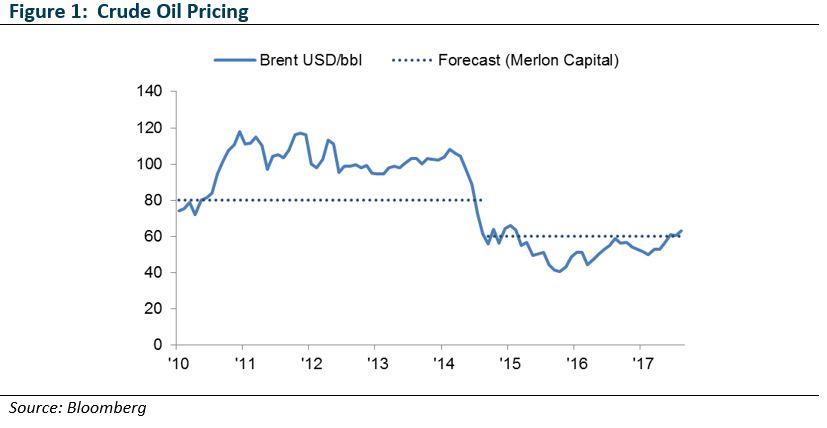
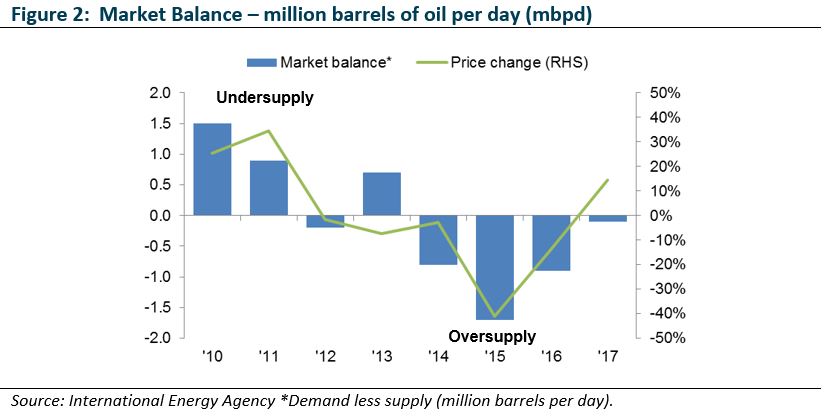
This period has been characterised by two clear phases. The first, represented by USD100/bbl pricing, saw producers unable to keep pace with the growth in demand, and were incentivised by high prices to invest in new capacity. The second phase was the result of this investment in capacity, whereby the rapid increase in supply saw the market deficit reversed and pricing pushed to USD50/bbl.
Echoes of the past – the first oil boom
The original oil boom began in the United States in the 1850s. Like the shale oil boom witnessed recently, the boom was sparked by technology. Europe, in the 1800s boasted an oil industry but relied on digging by hand, which ensured the industry remained a small one. The crude oil was refined into kerosene and used in lamps.
In the US, the use of kerosene lamps also spread, enabling the effective extension of working hours and hence output per worker. In meeting the supply requirement for kerosene, entrepreneurial producers used drilling derricks originally designed for salt drilling and powered by a small steam engine. They then used a hand pump, originally designed for pumping bore water, to extract the oil.
The new oil boom
Like the first oil boom, the last was premised on technology. The 2000s boom was initiated by the ability to drill in multiple directions (vertically down, and then horizontally outwards), coupled with the ability to fracture shale rock thousands of metres below the surface in order to stimulate the flow of oil and gas. It was this technological development, coupled with growth in the availability of capital through the effects of excess global liquidity that saw production surge.
Come out swinging – a new swing producer
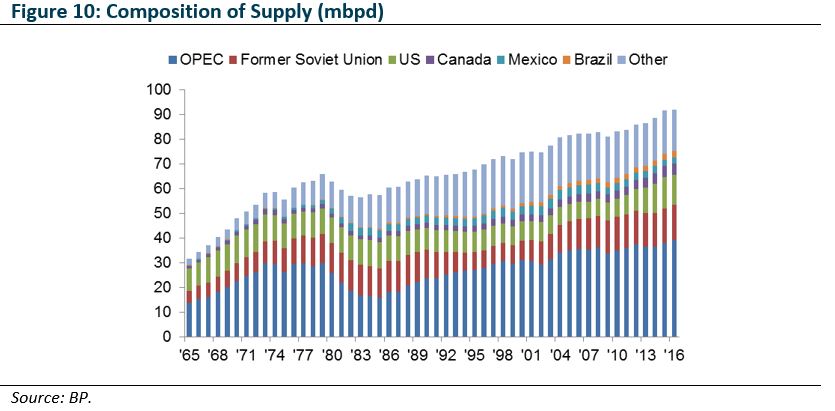
The proliferation of technology within the US oil and gas industry had effects broader than just on creating a surge of supply. The role of ‘swing producer’ – the producer actively seeking to keep the market in balance – has been held by Saudi Arabia, accounting for around a third of OPEC’s production volumes.
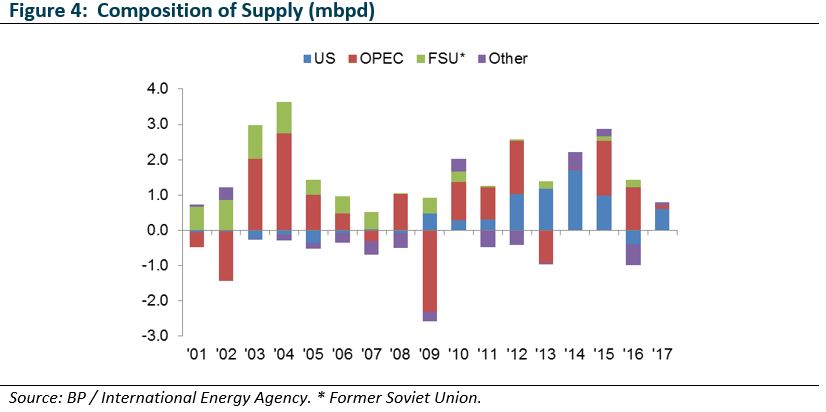
The ability of shale’s geology to significantly reduce the time to respond to market forces – turn the tap on and off so to speak – and deliver oil to market saw Saudi’s role in the dominant market player diminished (see chart below). This reduced the Kingdom’s ability to keep oil prices within an acceptable range and with it, the fiscal position of member states.
Where Saudi Arabia, in the form of its national producer – Saudi Aramco – is able to increase or decrease production significantly via a single decision from its oil minister, the United States production volumes are the result of hundreds of decisions of individual, public and private companies, motivated by the ability (or hope) to generate a return on capital invested. In this way we can see that Saudi actions are designed to ensure a stable price and end market, whereas US producer actions simply respond to price.
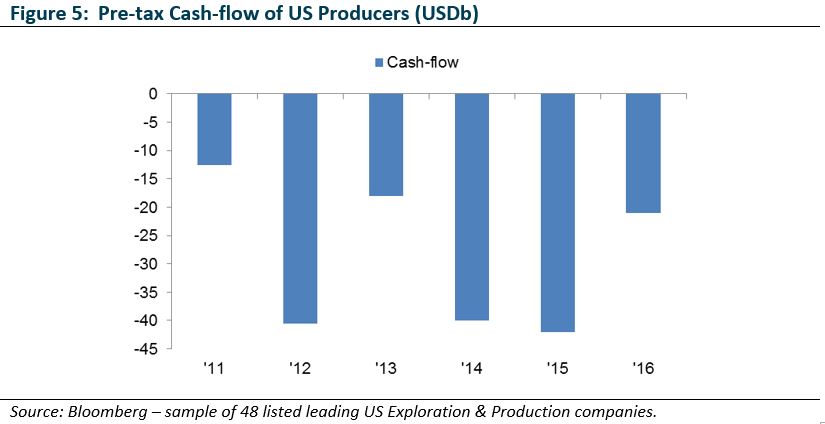
But where is the cash?
US shale producers have been capitalised in the expectation of growing production and ultimately benefiting from higher prices in the future. However, collectively, the industry has lost a combined USD175b over the period 2011-2016, with the effect of their collective behaviour (reminiscent of the original oil boom) destroying prices and capital.
While the reduction in capital spending by shale producers is highly visible in terms of drilling activity as well as actual output, perhaps less visible is the effect on conventional oil field activity, which has seen capital expenditure nearly USD100b lower than the peak. The effect on output is far less visible as it is felt over the longer term. It is for this reason that longer term pricing is likely to be higher rather than lower.
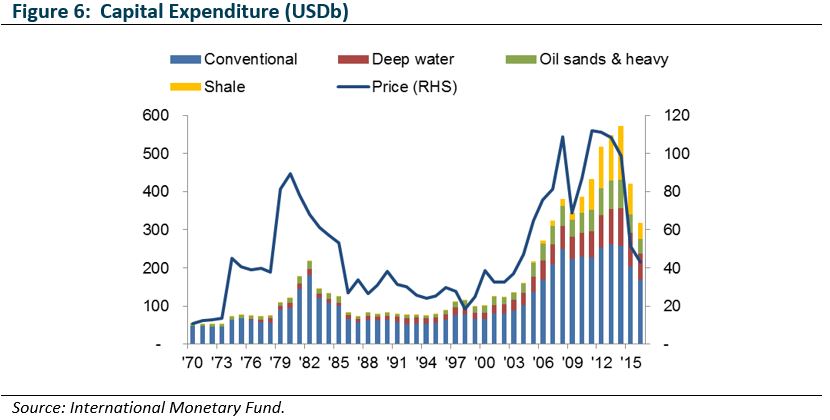
Capital expenditure slashed in the short-term
The chart below shows the effect of oil prices at ~USD50/bbl on capital expenditure. Capital expenditure on production capacity has more than halved from its 2014 level. This is important for oil production – continued investment is needed to offset the natural declines inherent in oil reservoirs. As the oil, gas and water is extracted from a reservoir, pressure depletes, reducing the flow of oil and gas. Capital expenditure is required to maintain pressure within the reservoir, as well as drilling additional wells, until the supply of economically extractable hydrocarbons is exhausted.
So how much do decline rates matter? The International Energy Agency calculated that for conventional oil fields, over the period between 1950 and 2012, oil output from existing wells declined by approximately six per cent each year. Applying this to current production would see 4.8mbpd of production lost each year. This figure is higher when factoring in the steeper decline rates of unconventional production in US onshore shale fields.
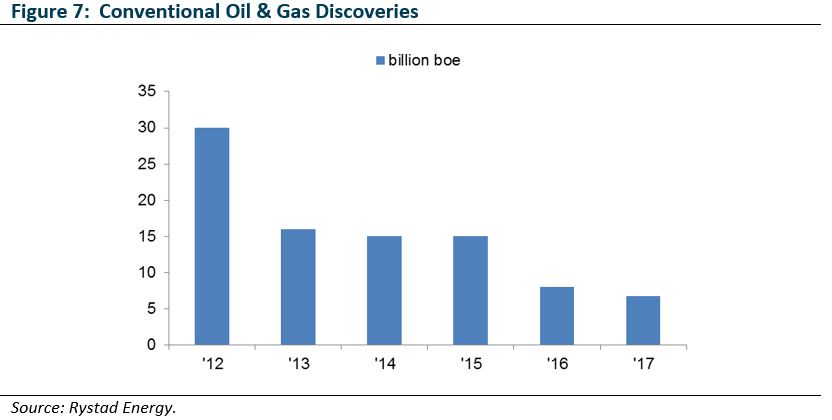
Discovery – striking oil
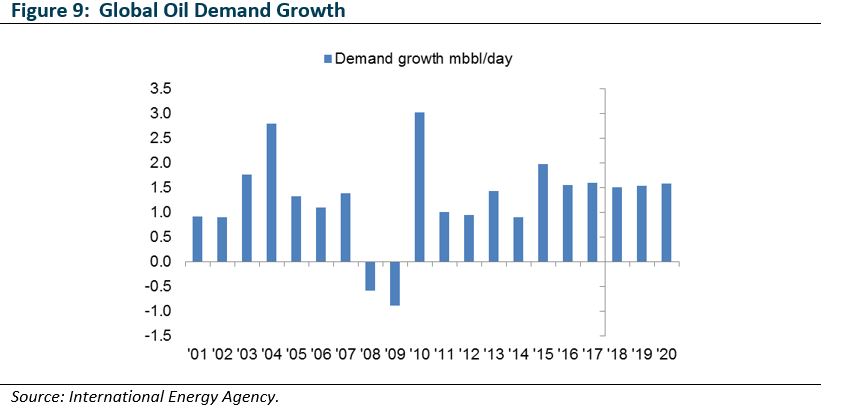
We now see the early effects in terms of lower discovery success, a function of the amount of capital spent (as well as luck). According to Rystad Energy, 2017 oil and gas discoveries are likely to have been 7 billion barrels of oil equivalent. This represents a record low and perhaps of more concern, dominated by gas rather than oil components. The implication of this are that the ability to address decline rates noted above, as well as meeting continued growth in demand of approximately 1-1.5mbpd. We turn now to this aspect, demand for oil and where the growth is coming from.
Oil – who is buying it?
The predominant change in buyer behaviour since 2001 has been the growth in Chinese demand, while demand in the Middle East has also grown. Much of this Middle Eastern demand is through heavily subsidised transport fuel and though oil-fired electricity generation. In the context of stretched national budgets, the ability of Middle Eastern economies to continue consuming oil at such levels is arguable.
Less arguable is the growth in Chinese demand. While entry into the World Trade Organisation saw Chinese heavy industry consuming significant volumes of diesel for transport and factories, the next phase of development is likely to see significant growth in petrol and diesel products for consumers.
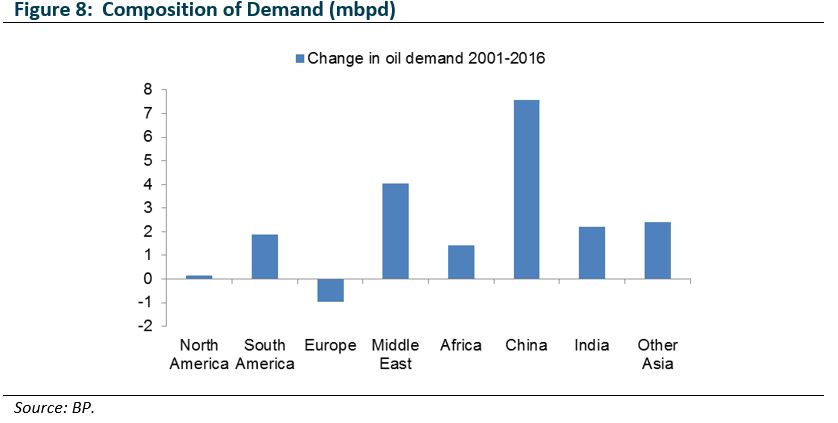
Overall demand growth has averaged 1.2mbpd of additional demand each year. A third of this growth has come from China, which is significant, albeit far less so than its contribution to demand growth across other commodities, with China accounting for primarily all additional demand. Regardless, it is likely China will continue to play a dominant role in the profile of future oil demand growth, even if its investment-led economic model slows as we expect.
Oil – who is selling it?
The key producer of oil globally is the organisation for oil exporting countries (OPEC), a 14-member production bloc founded in 1960, and dominated in terms of supply by Saudi Arabia. The second and third largest producers are Russia and the US. Of these OPEC remains the dominant production block, while the US is the most significant source of growth, accounting for more than half of the growth in supply over the past five years.
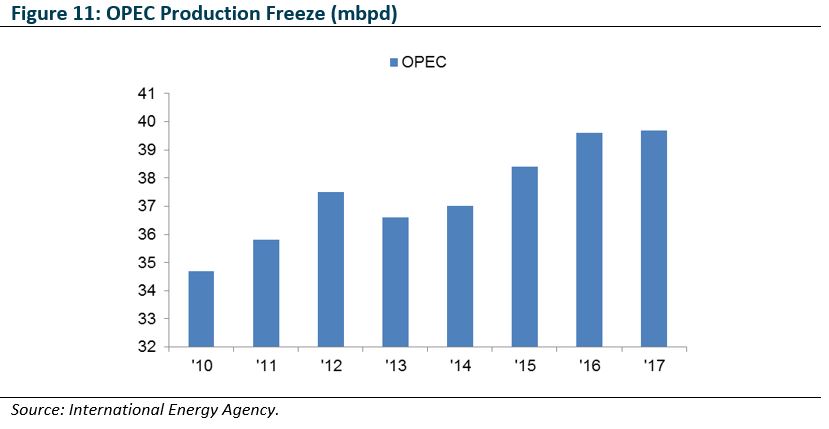
We expect the OPEC-led coalition production agreement to restrict supply to be eased as the market surplus is absorbed. The agreement is to expire at the end of 2018, subject to an interim review schedule for June.
While the end of production restraint appears negative for oil pricing, the ambition of the Saudi government to sell a proportion of Saudi Aramco is likely to be supportive of OPEC discipline, potentially limiting the downside to pricing from radical changes to the current production agreement.
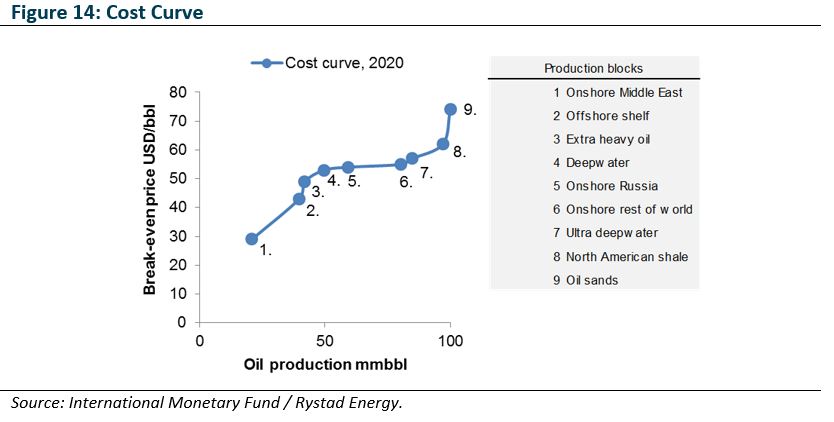
We also expect US onshore production growth to continue with more shale wells profitable at the current USD60-plus per barrel pricing, as shown in the cost curve (see below).
Current estimates suggest growth in US output of 0.5-1.0mbpd in 2018, accounting for much of the expected 1.0-1.5mbpd demand growth. Should production from the US spike more rapidly and favour nearby US producers, pressure would rise on the OPEC–led coalition policy to increase supply so as to not cede market share.
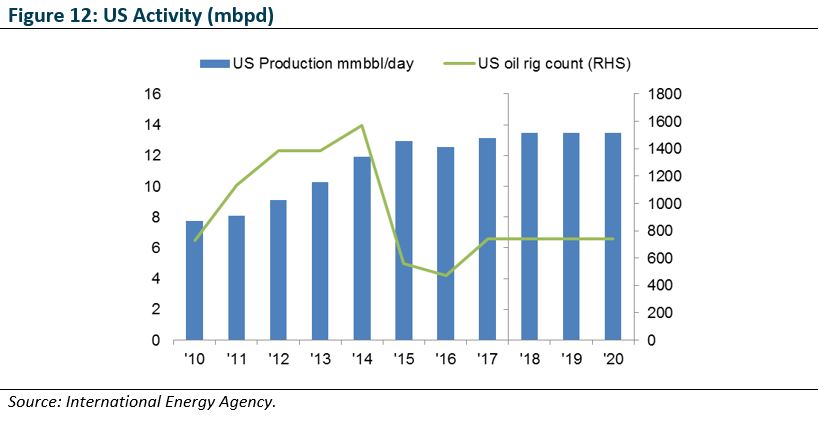
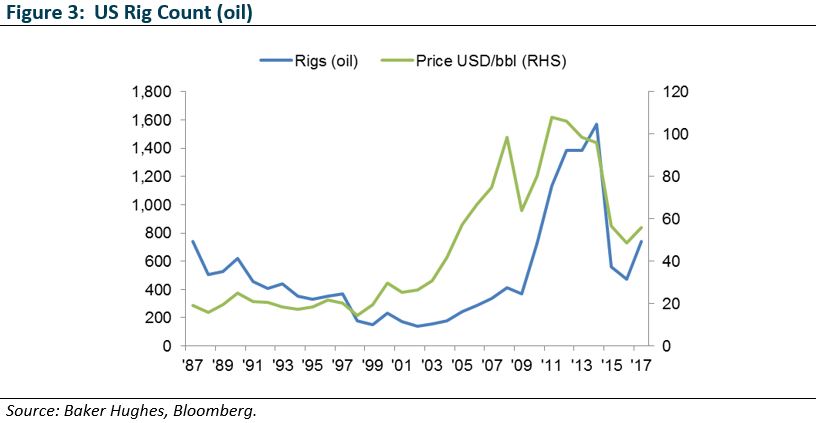
Although US production growth could place downward pressure on prices, it is not certain that the effect of the rapid decline in rig activity has impacted supply as might be expected. In fact US production has been supported, despite rig count halving, by well completions. These completions are the result of a lag between when a well is drilled, and when it is fracked. Further, the productivity of the remaining wells being drilled is higher than those likely to be brought online, given the need to focus on the most productive regions when oil prices were low. And finally, as interest rates rise in the US, and elsewhere, the flow of capital into the sector is likely to diminish, reducing capital available for continued activity.
On a longer term basis, as the US industry consolidates and the less efficient producers exit, we will see the effects of a depleted opportunity set of conventional fields available for development, given the declining discovery rates detailed above. As such we will see the upper end of the cost curve come into play in setting prices.
Conclusion
Pulling the above analyses together in the following summary table, we see what is likely to be a relatively tight market by 2020 across a range of scenarios.
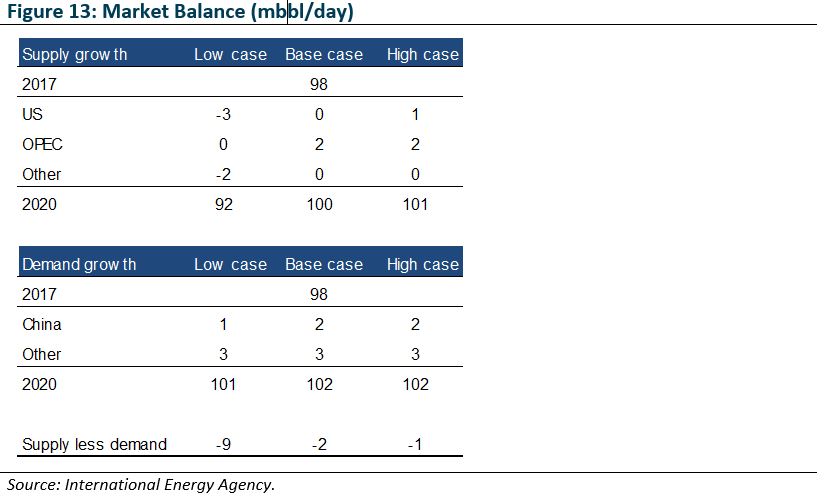
Pricing
A tight market sees the upper end of the projected cost curve deliver pricing of USD60-70/bbl, which is in line with current pricing of USD65/bbl. However, we forecast this pricing even after factoring in the easing of OPEC-coalition supply restraints and assuming growth in US production.
Fund positioning
Energy producers
The majority of Australian energy companies are exposed to oil prices via liquefied natural gas (LNG) assets. LNG is ultra-cooled gas, which shrinks the volume and physical state (from gas to liquid) enabling the gas to be transported via ship rather than pipeline.
For Merlon to invest in an energy company, the proposition must display valuation upside, as well as limited downside losses. Although our recent track record has been good, forecasting oil prices is difficult and as such, we focus on a range of valuation outcomes at different prices, all based on sustainable free cash flow and deducting debt.
As an example, Origin Energy and Santos showed potential upside in early 2016 in the context of low oil prices and continued investment required to complete their LNG projects. However a key difference between the two companies was the margin of safety, as measured by our bear case valuation. This bear case showed far less risk to investing in Origin, despite low oil prices, and hence provided conviction to continue to invest in Origin.
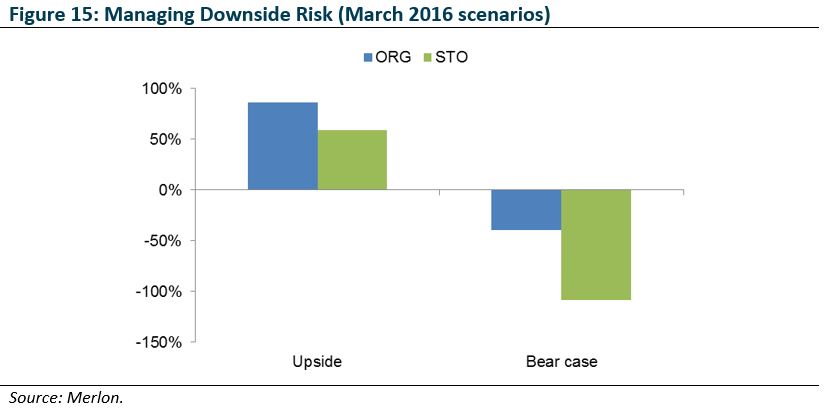
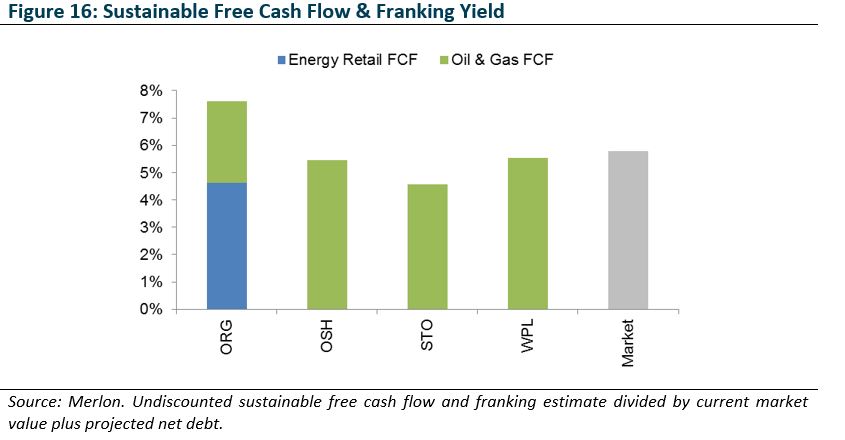
Where Santos is a pure upstream energy company, Origin also has a stable power generation and retailing business, which is less capital intensive than upstream gas extraction. When Origin was trading close to the value of its utility business in early 2016, the market was effectively valuing its upstream gas business as worth zero. This enabled Merlon to access the upside provided by the expectation of higher oil prices, without as much downside should this view fail to materialise. Merlon continues to hold Origin Energy across our portfolios.
Other potential investments in the sector included Woodside Energy and Oil Search. Woodside has a cash generative existing oil and gas business, however it has a declining production profile and is likely to become increasingly capital intensive as it seeks to address future production. Oil Search is similarly cash generative, however it is based in Papua New Guinea and hence does not generate franking credits. Further, it is similarly seeking new projects and will again see increased capital intensity.
Energy users
While producers of energy are obviously affected by oil prices, users of energy are also affected. Mining companies, for example, operate heavy industrial equipment and are highly energy intensive. Mapping Rio Tinto’s iron ore division unit costs against oil prices shows this correlation. The key stock implication of this is that buoyant demand for iron ore allows miners to pass on higher unit costs but should demand moderate and / or supply growth exceed demand, operating margins will be crimped by the recent rise in oil.
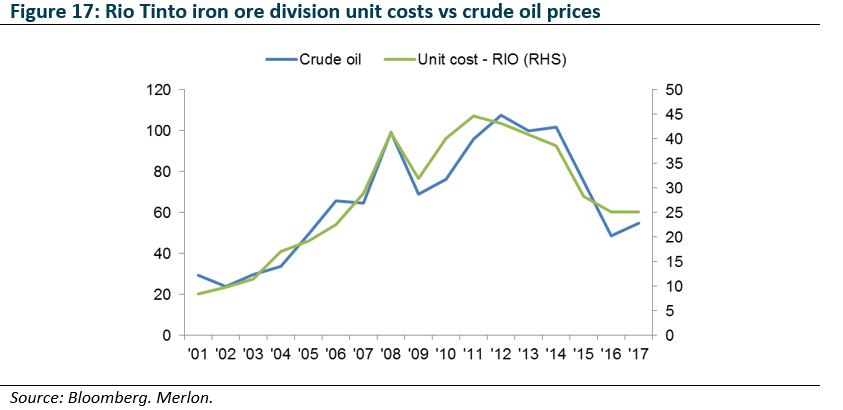
We model the effects of this in valuing the miners, and have no exposure to miners in the Fund. The effects of this have been unfavourable recently, however we expect the combination of softening industrial metals markets and tightening energy markets to combine to reduce unit cash returns of the miners, while increasing the profitability of energy producers.
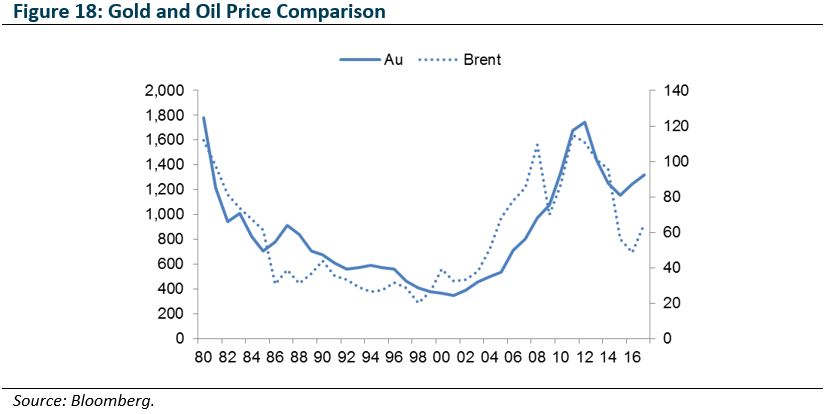
Inflation considerations
As a final word, with energy prices a significant driver of inflation, it is useful to compare oil prices with the price of gold, the most common inflation hedge instrument. The chart below shows the strong correlation between these two price series. While it is reasonable to expect the rebound in oil prices to drive a rise in global inflation rates, gold prices appear to be more than factoring this rebound in. As such, Merlon has no exposure to gold exploration and production companies.
Author: Ben Goodwin, Analyst/Portfolio Manager