Iron Ore: Supply Disruption is Temporary; The Transition to Recycling is Permanent
The effect of Vale’s tragic dam collapse in early 2019 has seen iron ore prices rally. As a result of forced mine closures, the global seaborne supply of iron ore is expected to be 20mt lower in 2019 than in 2018, or 1.2% of the total seaborne market. Despite a slowing economy, Chinese steel demand in 2018 remained relatively strong, albeit importing ~10mt less iron ore relative to 2017 as use of scrap steel increased, a trend expected to continue for some time. This note summarises the implications of these factors and how they affect the longer-term market balance and pricing.
Supply
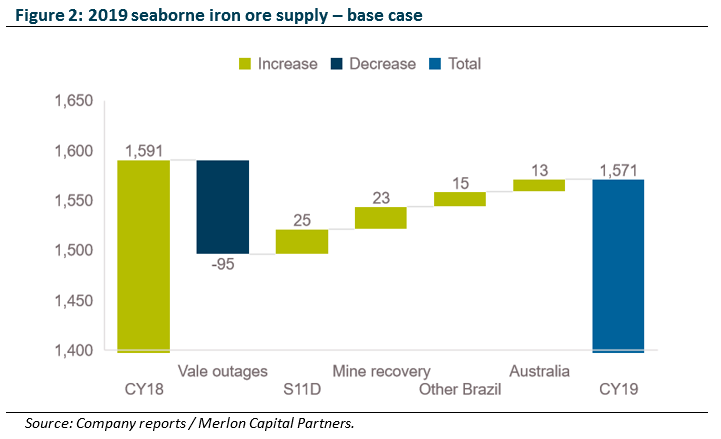
The short-term iron ore market has tightened unexpectedly on supply interruptions in Brazil, and exacerbated by cyclone activity in Western Australia. As a result of these events, we forecast a 20mt reduction in seaborne iron ore in 2019 relative to 2018 (1.2% of the 1.6 billion tonne global seaborne iron ore market). Vale exported 366mt of iron ore in 2018 (~20% of the 1.6bt seaborne market), albeit having produced 385mt, building stockpiles by ~20mt, reflective of a weakening demand environment.
Vale’s dam burst has seen supply impacted via a 40mtpa dam remediation program over two years, and the court-ordered shut-downs of the Brucutu (30mt), Timbopeba (15mt) and Alegria (10mt) mines. Countering these disruptions is Vale’s continued ramp up of its 100mt S11D project (+25mt in 2019), and the likely return of the Brucutu mine. The net effect of these changes is a loss of 48mt. Outside of Vale, I expect Anglo American’s Minas Rio mine to add 15mt of production, while BHP and RIO are expected add a further 8mt (including the effect of recent cyclone activity), and Roy Hill 5mt. The net effect is that 2019’s global seaborne supply of iron ore likely to be 20mt lower than 2018 (see chart below).
The above analysis factors in expected mine activity in the major producing hubs of Australia and Brazil. In addition to this activity, additional potential offsets are as follows:
- The likely unwind of Vale’s ~20mt inventory build from 2018, likely a function of Vale’s S11D project ramp up, coupled with weakening demand for iron ore and a desire from major producers not to destabilise the market with excess supply growth.
- China’s domestic production of iron ore is currently operating at levels less than 50% of its 400mt capacity. Early expectations are for at least 10mt of supply to be added in response to elevated iron ore pricing.
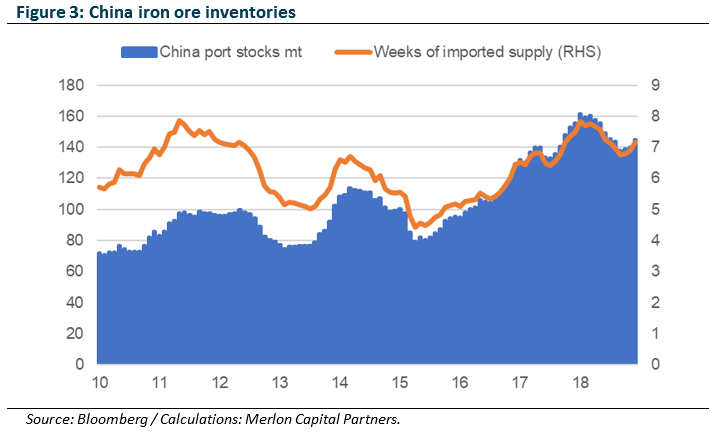
- China’s port stockpiles of iron ore are at elevated levels (see chart). Drawing down these stockpiles to 6 weeks of imported supply (average level) would release more than 25mt of iron ore into the market.
These three additional offsets amount to an additional 55mt of supply and would more than offset Vale’s net 48mt production losses. And this is before factoring in any (likely) response from higher cost, ‘non-traditional’ producers such as South East Asia, West Africa and South America, or a return to export markets from India, once a 100mt exporter.
Demand
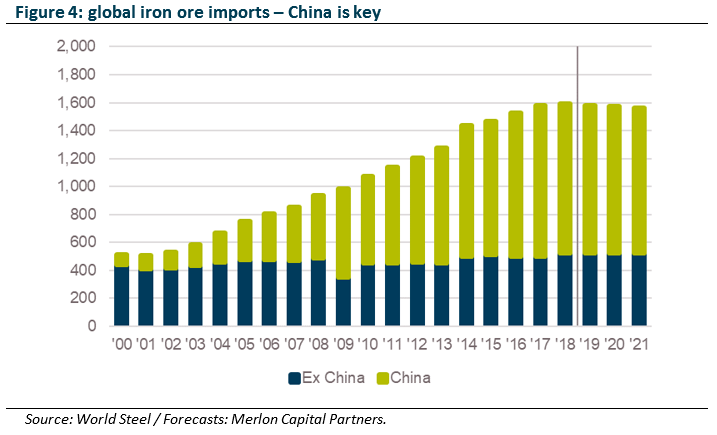
The spike in iron ore prices in early 2019 has been a supply-driven event. It is worth assessing demand, however, with China producing half of the world’s 1.8bt steel and accounting for 2/3rds of the 1.6bt seaborne iron ore market.
China, as the world’s largest importer of iron ore, saw its imports of iron ore peak in 2017. This was followed by a decline of 1% in 2018 as the policy driven transition towards scrap steel recycling began.
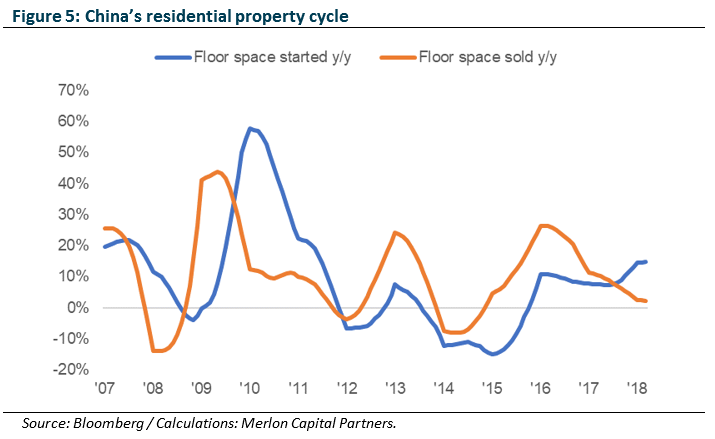
In terms of downstream demand for steel in China, roughly half of steel demand is attributable to the property market, Housing starts were surprisingly strong in 2018, outpacing housing demand significantly in 2018 – as the chart shows, new starts ultimately follow sales activity. It is worth noting that only 30% of apartment sales are attributable to first home buyers, down from 70% in 2008 – in short, the market is becoming increasingly speculative. In addition, more than 2/3rds of new starts occur outside of China’s Tier 1 cities, regions where inventories are most elevated.
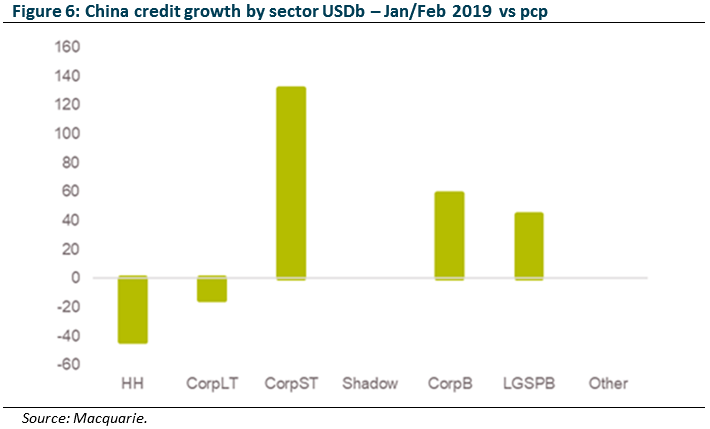
China’s weakening economic activity indicators have seen growing expectations of a 2015/16-style stimulus. However, stimulus to date has focused on tax cuts (consumer / SME targeted) and infrastructure (local government financing), coupled with a January rebound in credit flows (see chart below), albeit focused on short term corporate financing, rather than long term investment directed lending.
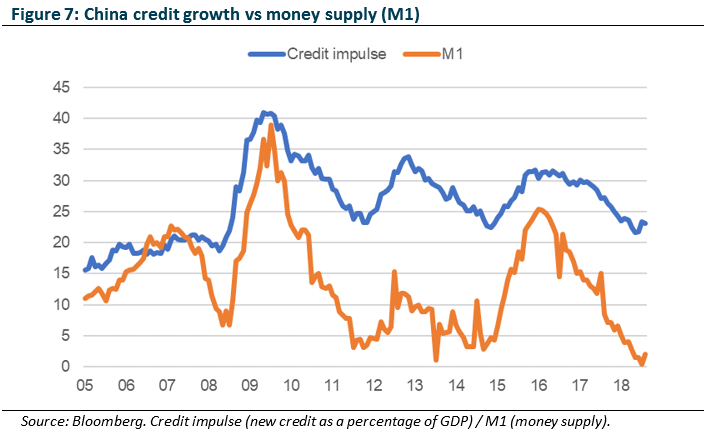
Further, although early 2019 credit flows demonstrated a rebound, it would require a significantly larger, and more sustained effort to impact the real economy in the manner seen in 2016 (measured by Money Supply) given the diminishing effectiveness of credit on economic growth.
Importantly, unlike 2015/16 stimulus, the property market remains in relatively tight policy mode given already elevated property prices.
Putting it together: CY19 market balance
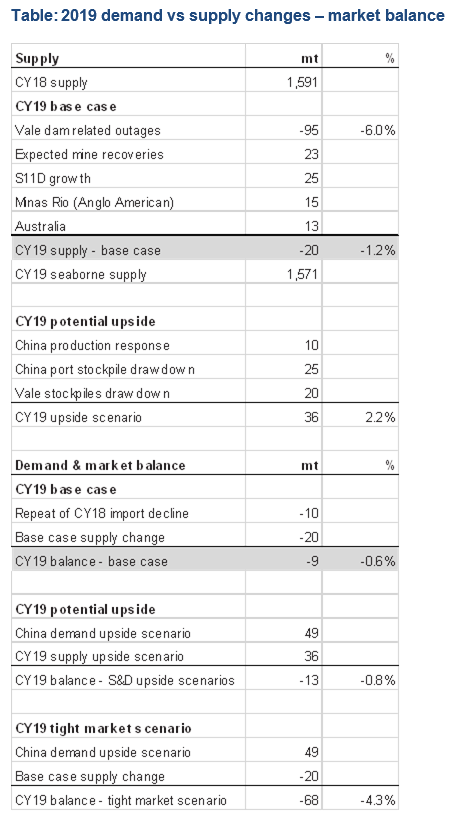
While the effects of seasonality and unexpected supply outages have seen pricing at elevated levels, we do not expect the market to remain tight as these factors are likely to be largely offset by supply growth elsewhere. This is our base case expectation, resulting in a slight market deficit of less than 1% (see table below) for 2019.
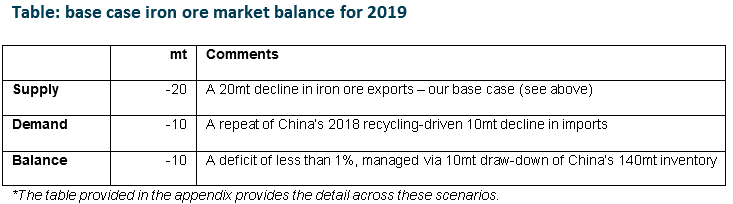
Other scenarios (see appendix) are also considered, albeit less likely. Should demand surprise to the upside, via a resumption of China’s historical growth trajectory, then the likely production upside will be more incentivised, again leading to a deficit of less than 1%.
A scenario where China resumes its growth trajectory and production does not respond is considered unlikely, albeit a scenario that is currently being factored into prices. As this scenario is proven less likely over time, pricing is expected to revert.
Beyond 2019, while Vale’s production outages have seen the focus of the market become more short term focused, the supply disruptions will unwind over subsequent years, with the 95mt of affected production is returned to the market. Should this occur in conjunction with price-incentivised production growth elsewhere, the negative effect on pricing could be pronounced. And that is before considered the most dominant factor likely to affect iron ore demand in the medium to long term.
Substitution
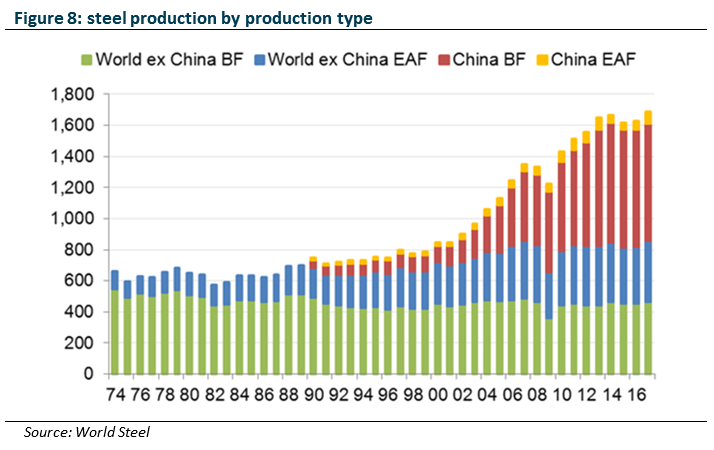
The key factor driving the demand for iron ore over the medium to long term will be the transitioning of China’s steel production from iron ore fed blast furnaces to recycled steel fed electric arc furnaces. Chinese EAFs currently account for less than 10% of total steel production (this figure is 45% for the rest of the world). This proportion will grow as Chinese policy favours any new capacity to be achieved via EAFs. Over the long term, should China’s recycling rate approach that of the rest of the world, approximately 300mt of steel currently produced using iron ore would switch to being produced using recycled steel.
What does this mean for equities & value investing?
Perhaps the simplest way to describe value investing is the desire to pay 50c for a dollar coin. Conversely, a value investor will seek to avoid paying $1.50 for the dollar coin. This is relevant in today’s market for iron ore exposed equities.
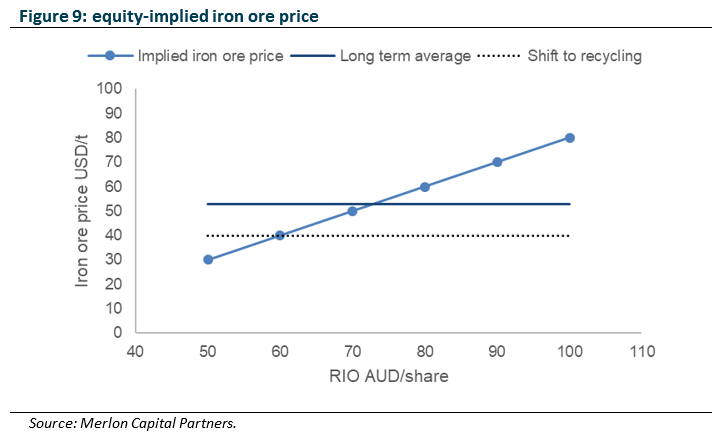
Using Rio Tinto (RIO) as an example, the current share price is factoring in around USD80/t to price RIO’s equity. Less than spot pricing of USD93/t perhaps, yet still a hefty 50% above the long-term average iron ore price (see chart). This is before factoring in any effects of structural change on iron ore demand (see above transition towards recycling), a factoring happening now and to set to increase over time, and highly unlikely to reverse.
The efficient market hypothesis requires the market to price in all available information. Of course, the most visible and available information is today’s iron ore price. While short term rational, it does not question whether USD93/t (or the USD80/t current priced) is sustainable – so potentially long-term irrational.
At Merlon Capital, we value assets on the basis of sustainable earnings, investing where the market is undervaluing sustainable earnings and avoiding companies where the market is pricing in unsustainable earnings, regardless of the current environment. It is this position, which, over time as earnings gravitate towards sustainable levels, that alpha is generated.
In the current iron ore environment, on the assumption that disruption driven pricing is sustained for a year, the maximum additional value which is created is $1.15 free cash-flow per share. The remainder of the asset value is unchanged as our assessment of a sustainable iron ore price is unchanged. Again, we do not wish to pay $1.50 for a dollar.
While cash-flows generated by the iron ore exposed miners are attractive, they are built on the combination of unsustainably high prices, and unsustainably low capital expenditure. The recent ~30% decline in the thermal coal price reminds us of the volatile nature of commodity prices. And if the dam issues experience by Vale tell us anything, it is the risk that miners are not spending enough on their assets.
Conclusion
The market’s expectation of stimulus, coupled with the uncertainty regarding Vale production, has seen iron ore pricing and associated equities rally strongly, driven by the ‘sticker shock’ of the headline, unadjusted supply outages. However, when factoring in offsetting activity, the net disruption on the overall market balance appears modest, while there is a risk is that low blast furnace spreads will see substitution and demand for scrap rise, potentially accelerating the transition to recycling, displacing iron ore more rapidly than expected.
Author: Ben Goodwin, Analyst/Portfolio Manager
Appendix: market balance scenarios