
Value Investing: An Australian Perspective Part III
While the long term returns from “value investing” are strong and well documented, the approach has struggled over the past decade prompting many investors to question its merits.
This paper represents the third of a three part series discussing value investing from an Australian perspective. In the first paper we concluded that value investing on the basis of free-cash-flow has performed well through a number of market cycles and has displayed low levels of volatility when compared to traditional classifications of value such as earnings, book value and dividends.
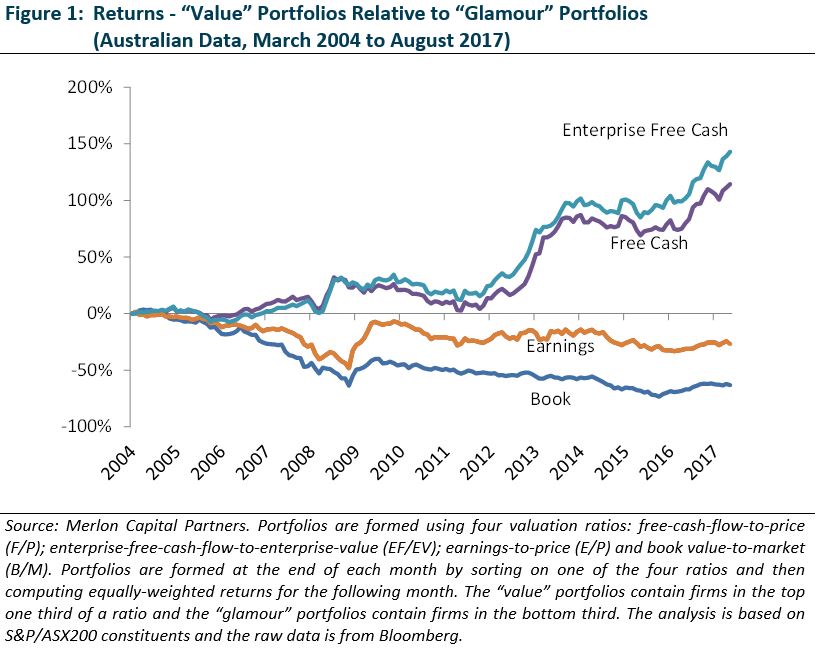
In the second paper, we began to explore the question of why value strategies based on free-cash-flow outperform the broader market. Consistent with our philosophy, we presented findings that show a linkage between value investing on the basis of free-cash-flow and earnings quality and went on to dismiss the notion that value investing is “riskier” than passive alternatives.
In this third paper, we discuss some behavioural biases in investor risk assessments and expectations. We also point to various elements of the Merlon investment process, structure and culture that are aimed at minimising our exposure to these biases.
Misperceptions about risk
In our second paper of this series, we presented evidence that value investing on the basis of free-cash-flow in an Australian context is no “riskier” than passive alternatives. But if value strategies are not riskier than glamour strategies then only systematic errors by investors could account for outperformance. Systematic errors could relate to either:
- Misperceptions about risk; and/or
(value stocks are be perceived to be riskier than they actually are) - Misperceptions about future cash flow.
(growth prospects for value stocks are perceived to be worse than they actually are)
To exploit the outperformance of value stocks, any value investor needs to understand these biases and minimise them through investment process and firm culture.
As flagged earlier, the idea that value stocks are riskier is intuitively appealing given their unpopularity and high levels of perceived uncertainty. Investors might seek higher rates of return for owning these stocks to compensate for perceived higher risk profiles.
Empirical evidence such as that presented earlier suggests that investors should not be concerned about these risks at a portfolio level. That said, it is possible that in practice this is not the case[1]. Some examples of behavioural biases that cause misperceptions about risk are:
- People are loss averse: People are more sensitive to losses than gains.
- The degree of loss aversion depends on prior gains and losses: A loss that comes after prior gains is less painful than usual, because it is cushioned by those earlier gains. Conversely, a loss that comes after prior losses is more painful than usual.
- People engage in narrow framing: Loss aversion is applied to narrowly defined gains or losses (i.e. individual stock performance).
What this all implies is a discount rate for individual stocks that changes as a function of a stock’s past performance. If a stock has had good recent performance, the investor is less concerned about future losses and values the stock more highly. If a stock has performed poorly, the investor finds this more painful, becomes more sensitive to the possibility of further losses and discounts expected future cash flows at a higher rate.
At Merlon, we try to avoid this issue entirely by applying standardised discount rates for all stocks we cover. We also have a portfolio construction approach that, subject to rigorous peer review, is directly linked to analyst research output. This removes an element of subjective override that can be more prone to behavioural biases. That said, we need to be constantly aware of areas where these biases might creep into our process and portfolios. Some examples are:
- Loss aversion: When we present sensitivity tables internally, all eyes and discussion immediately focus on the worst case outcome, sometimes with total disregard for the best case outcome or sometimes even the base case outcome. This focus becomes more pronounced when we are reviewing a stock that has lost money or where recent aggregate portfolio performance has been disappointing.
- Narrow framing: Narrow framing is often evident when we analyse stock attribution internally and when we present attribution to our clients. Discussions are dominated by stocks that have underperformed over sometimes very short periods of time even when the losses attributed to these stocks are small within the context of longer term portfolio performance and risk characteristics.
While much of the academic literature implies that individual investors are more exposed to these biases than institutions, in our experience these biases are often reinforced by institutional processes and cultures. For example:
- Remuneration structures: Analysts that are measured and remunerated with regard to the performance of a small number of stocks over a short time frame are hardwired to focus narrowly.
- Reporting structures: If individuals are more sensitive to losses than gains, then individuals under the close scrutiny of superiors and/or clients that are similarly inclined are even more likely to be emotionally sensitive to losses over gains.
- Asymmetric consequences: Emotional sensitivity aside, analysts might steer away from unpopular stocks simply because they are difficult to justify to clients and/or superiors. The consequence of losing money on such a position (i.e. losing a client, a promotion or your job) may be greater than losing a similar amount of money on a more popular stock.
At Merlon, we have a long term performance orientation and an extremely flat structure with a high degree of analyst responsibility and accountability. The portfolio is hard-wired to reflect analyst research output, subject to rigorous peer review and sensible risk constraints. Analysts are completely aligned with client outcomes and are financially rewarded based on total career performance at the firm rather than rolling shorter-term periods. We think it is inappropriate to measure performance over any period less than five years. This combines with our standardised valuation approach and a deep awareness of our vulnerabilities to minimise our exposure to these behavioural biases.
Misperceptions about future cash flows
Risk considerations aside, it is possible that value strategies outperform because of misperceptions about future earnings and cash flows. We believe that one of the reasons the return differential between value and glamour stocks emerges is because investors extrapolate past growth rates too far into the future and put excessive weight on recent past history in forming predictions[2].
To illustrate this phenomenon, we went back 10 years and sorted all ASX200 constituents according to their sales growth over the preceding five years. We placed higher weight on more recent sales to reflect investors’ tendency to put more weight on short term results and divided sales by the number of shares on issue to adjust for companies that had grown revenues through acquisitions or heavy investment.
From this sorted list we created three portfolios representing companies ranking in the top third, middle third and bottom third for prior growth in sales. We rebalanced these portfolios on a monthly basis, adjusting index constituents and updating the sales growth calculations each time companies reported.
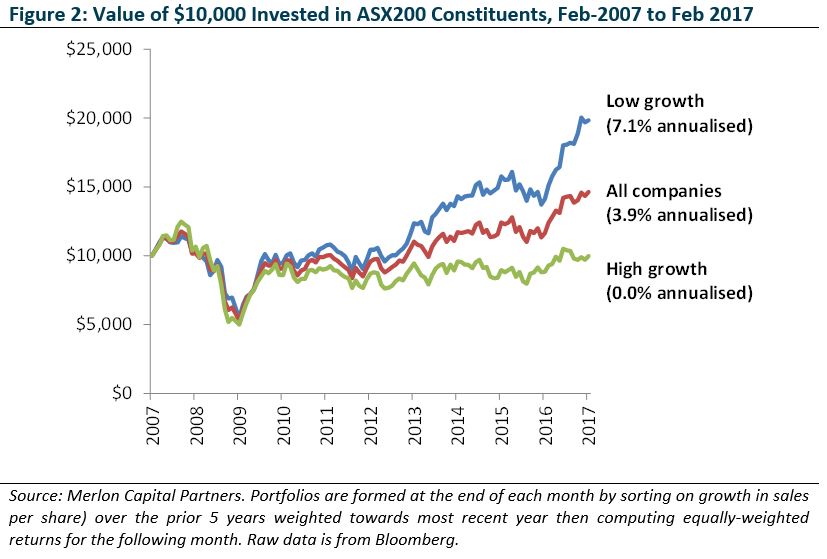
The results highlight that systematically purchasing stocks with deteriorating sales growth would have outperformed the market by around 3 percentage points per annum over the last decade and outperformed stocks with accelerating sales growth by around 7 percentage points per annum. These stocks are often the most difficult to justify to clients and marketing departments. It is for this reason that we believe this anomaly is likely to persist.
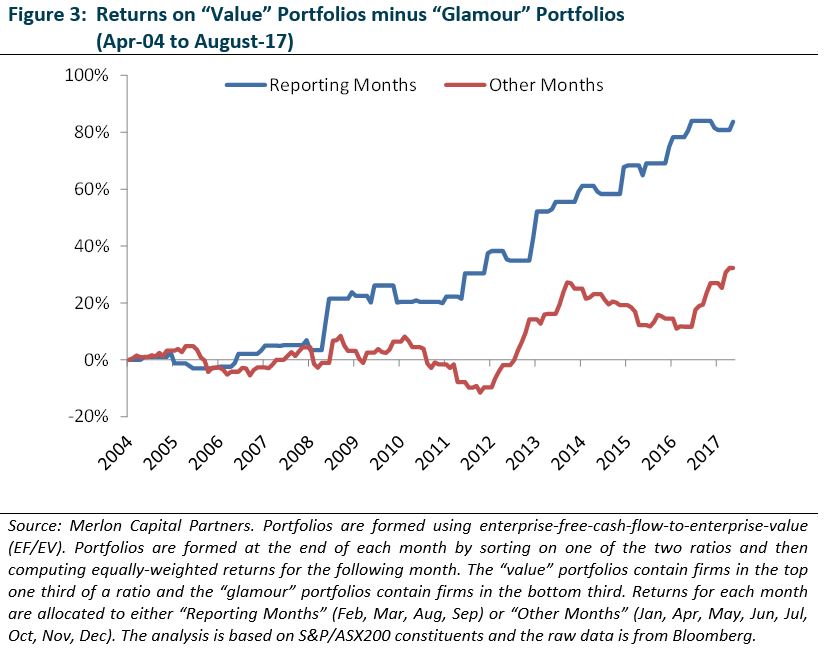
If investors form overly pessimistic (optimistic) expectations about future earnings prospects of value (glamour) stocks, then this would lead to subsequent price rises when these expectations are exceeded. Expectational errors are most likely to be realised following the release of public information such as earnings announcements.
Our analysis of recent Australian data supports this hypothesis. Of the annual average excess return of 7.1% of value stocks relative to glamour stocks, 4.7% was earned over the four months of the year when most companies report their interim and final results (February, March, August and September).
The tendency to extrapolate recent history in forming predictions is a common error in psychological experiments, not just the stock market, and could combine with a number of other behavioural traits to lead to overly pessimistic (optimistic) expectations about future earnings prospects of value (glamour) stocks. In particular:
- Representativeness: Individuals view a small number of events as “typical” and ignore the laws of probability in the process. Investors might classify some stocks as growth stocks based on a history of consistent earnings growth, ignoring the likelihood that there are very few companies that just keep growing.
- Overconfidence: Individuals overestimate the precision of their assessments and in doing so strongly attribute events that confirm the validity of their actions to high ability, and events that disconfirm the action to external noise. This causes overreaction and momentum in security prices, but this momentum is eventually reversed as further public information gradually draws the price back towards fundamentals. This overconfidence is a form of attribution bias.
At Merlon, our peer review process is heavily skewed towards long term and factually based information. We generally seek a minimum of 10 years trading history when presenting a business with often much longer time series considered with regard to macroeconomic and other external cyclical influences.
Concluding comments
Any investment philosophy needs to be supported by an understanding of why a particular approach is likely to generate excess returns. In this paper we highlight a number of well documented behavioural biases that are empirically and anecdotally evident in the Australian market.The performance of value investing on the basis of free-cash-flow in an Australian context has been compelling and, in our view, represents a strong foundation for active stock selection. This key finding underpins Merlon’s investment philosophy which is built around the notion that companies undervalued on the basis of free cash flow and franking will outperform over time.
We also point to various elements of the Merlon investment process, structure and culture that are aimed at minimising our exposure to these biases.
Author: Hamish Carlisle, Analyst/Portfolio Manager
[1] See, for example: “Mental Accounting, Loss Aversion, and Individual Stock Returns”, N Barberis, M Huang – The Journal of Finance, 2001
[2] See, for example: “Contrarian Investment, Extrapolation and Risk”, J Lakonishok, A Shleifer, R Vishny – The Journal of Finance, 1994